Traces
A trace is one request, followed through every service it touches. Each step is a span: an HTTP call, a database query, a call to another service. Traces show you where a slow request spent its time and where a failing one broke.
Open Observability → Traces on your status page. Each row is one request.
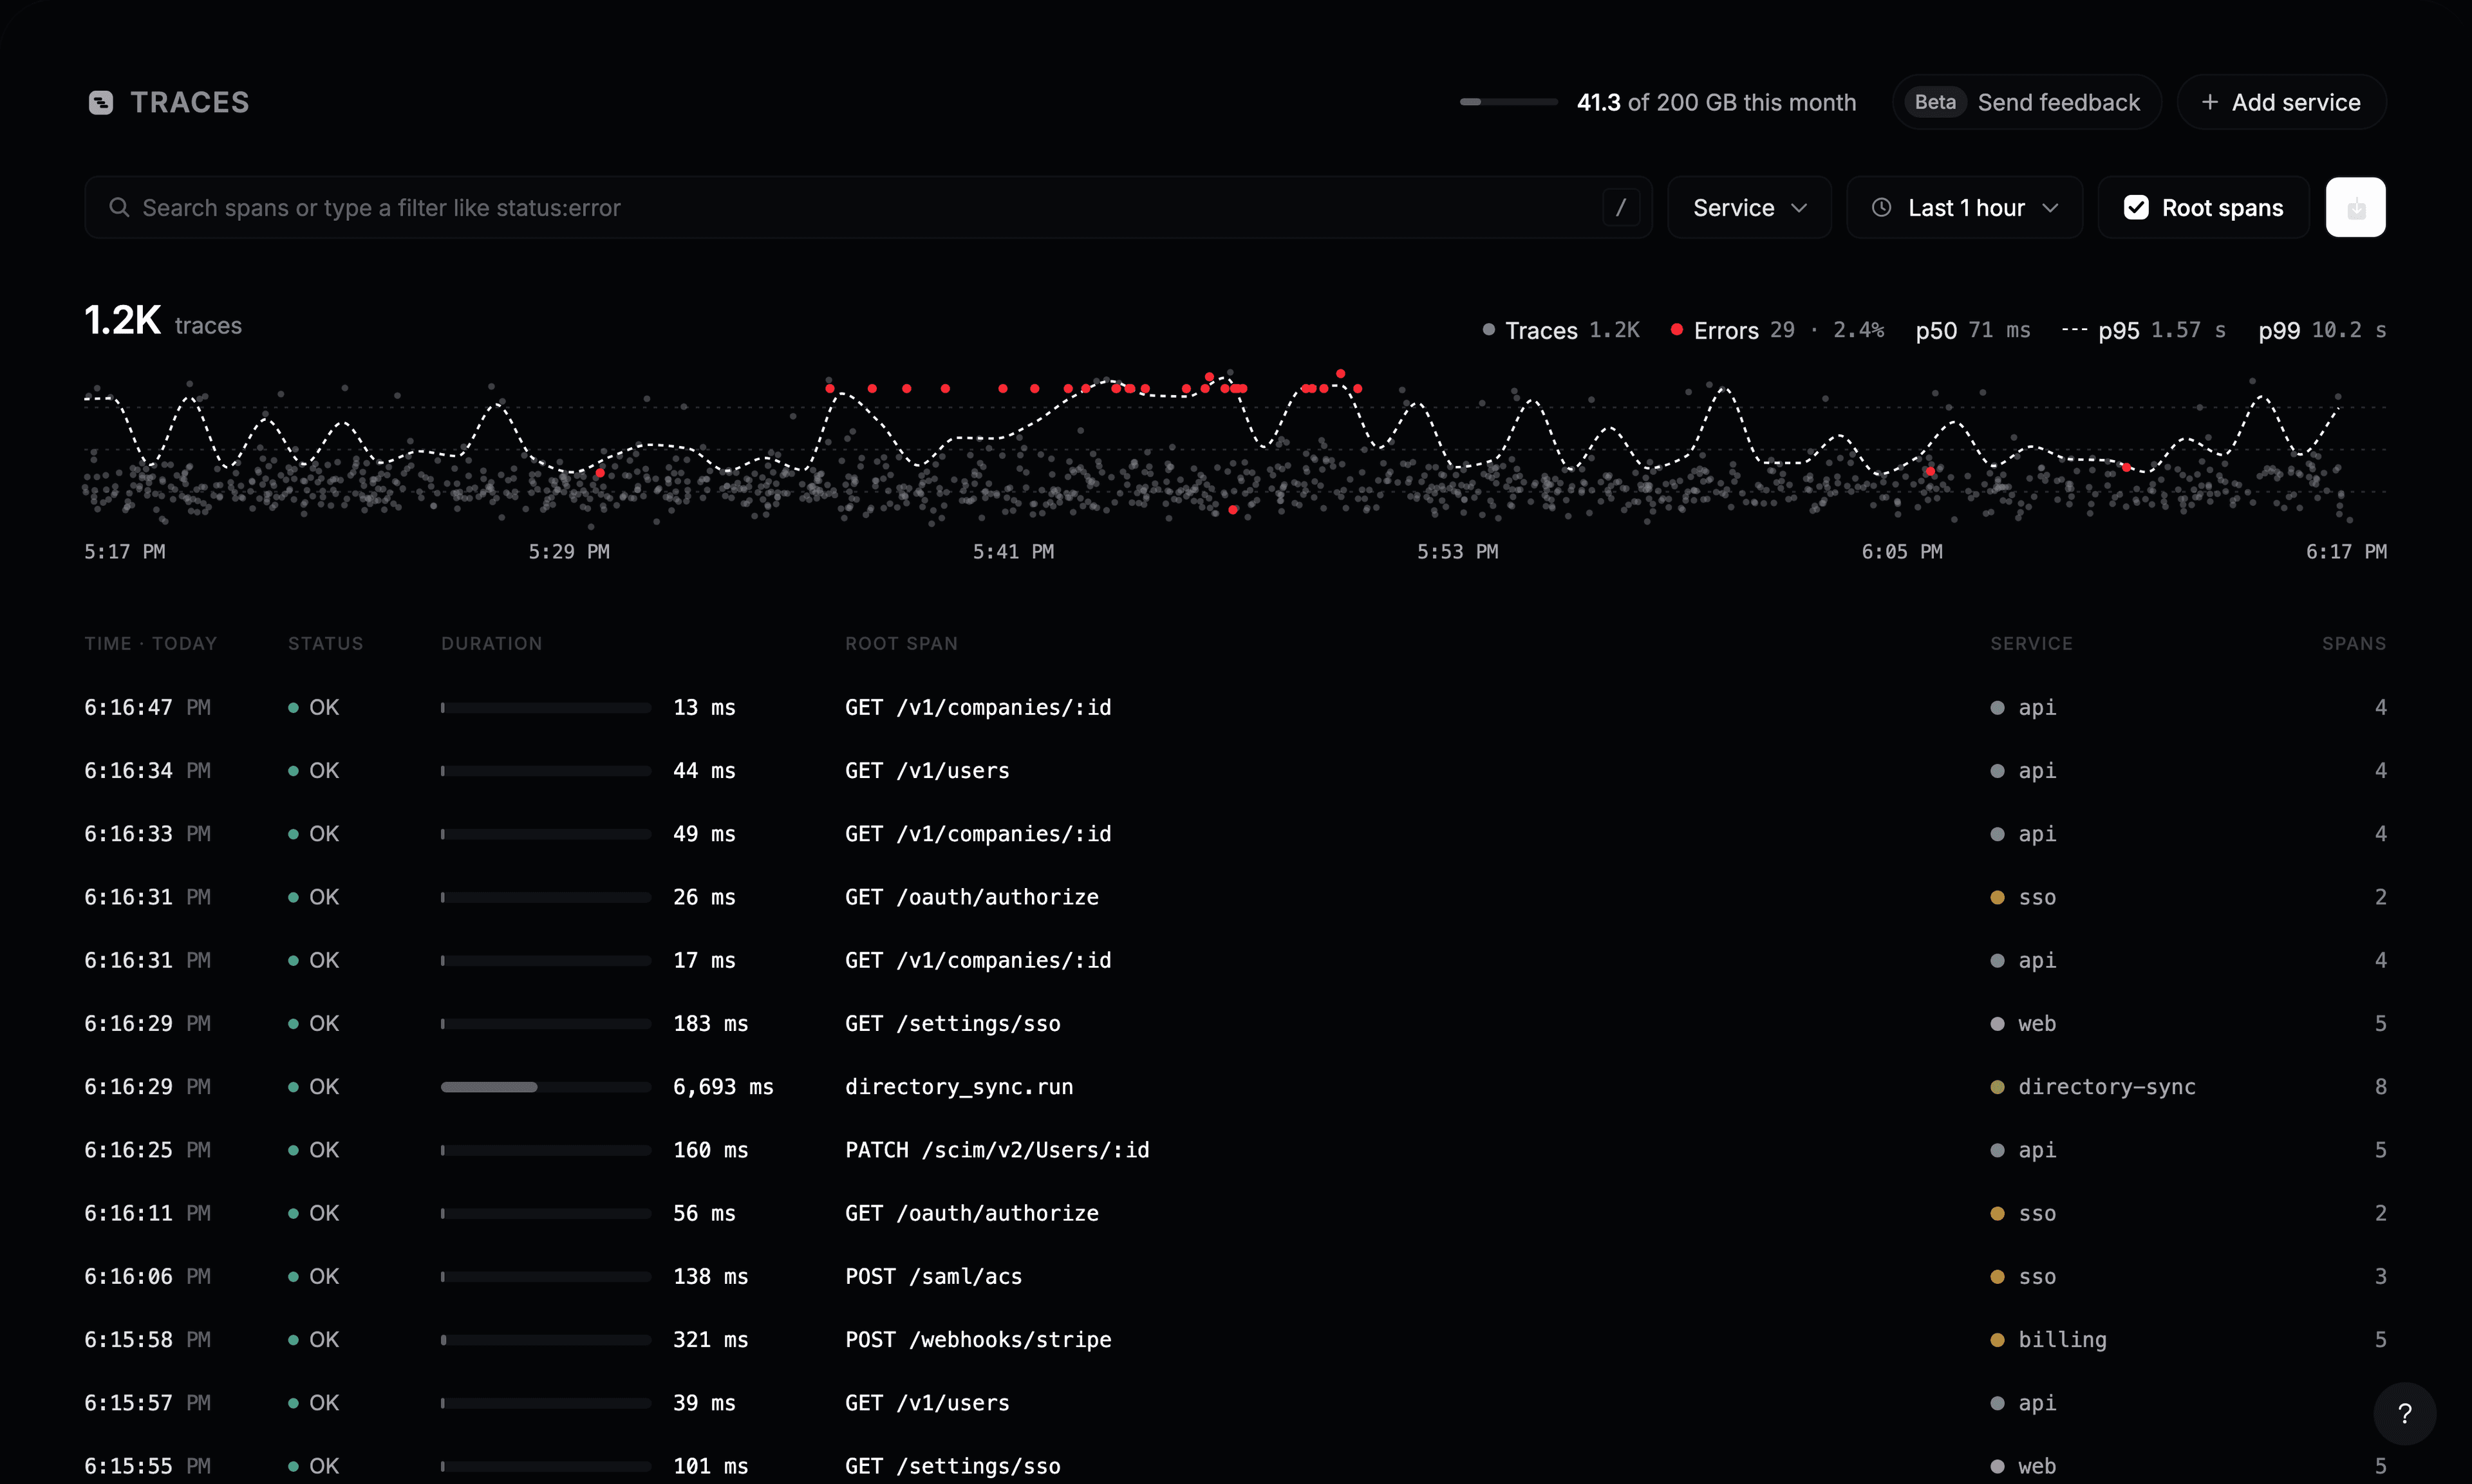
Traces arrive once your app sends them: tick Traces when you copy the setup prompt, or use auto-instrumentation.
Read the chart
Every dot is a request, placed by when it happened and how long it took. Red dots failed. Above the chart:
- Traces: how many requests the search found.
- Errors: how many failed, and their share.
- p50, p95, p99: half, 95% and 99% of requests were faster than this.
Drag across the chart to zoom into a time window.
Find slow and failing requests
Use the search box like on the Logs page. These filters are made for traces:
| Filter | Finds |
|---|---|
status:error | Requests that failed |
duration:>1s | Requests slower than one second. Also >500ms, <100ms |
service:api | Requests handled by one service |
span.name: | Spans with a given name, such as GET /v1/users |
| Any attribute | Such as http.route: or http.response.status_code: |
Free text searches span names. Root spans is on by default, so each request shows once. Turn it off to list every span on its own.
The download button exports the list as CSV.
Open a trace
Click a row. The trace opens with every span on a timeline, nested under the span that called it. Long bars are where the time went.
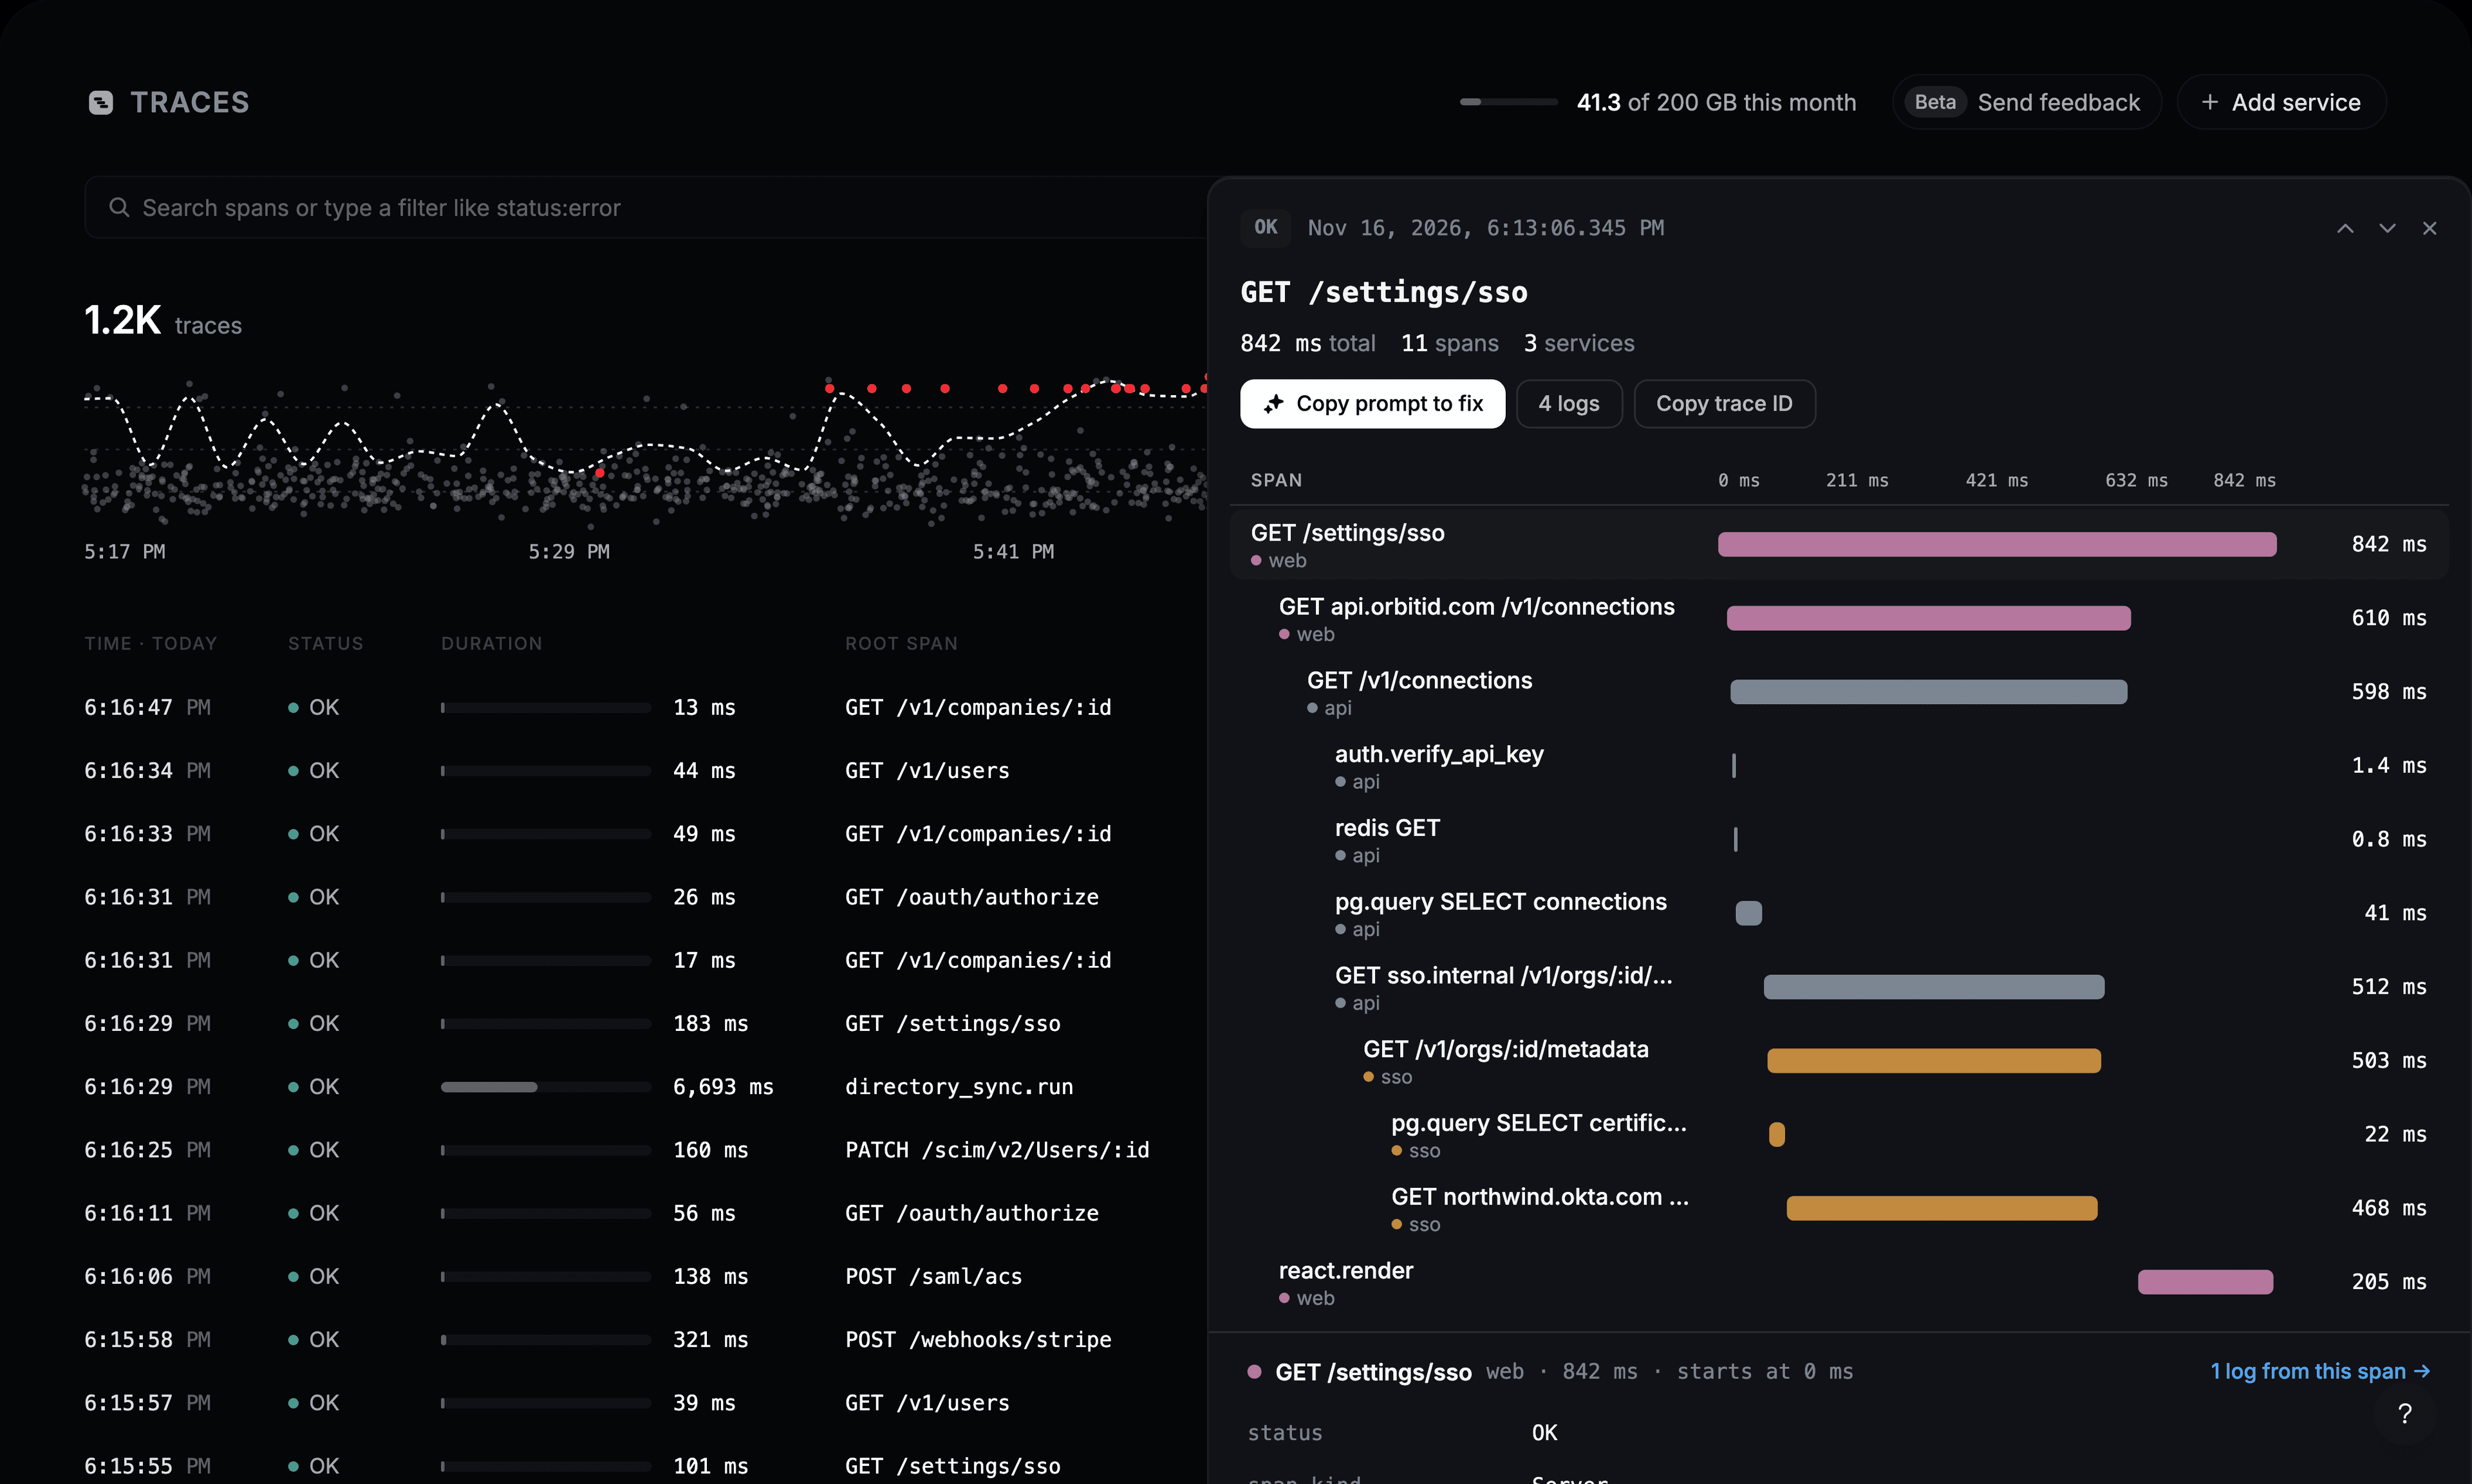
In this example a page load takes 842 ms. The waterfall shows why: web calls api, api calls sso, and sso waits 468 ms on Okta.
- Click a span to see its attributes, such as the route, status code or database query.
- N logs from this span opens the logs written during that span.
- N logs at the top opens every log of the request, across services.
- Copy trace ID copies the ID, to share or to search with
trace_id:. - Use ↑ ↓ or J K to move to the previous or next trace, and Esc to close.
Fix a failing request
Failed spans are red. Only errors hides the spans that worked, so the failure stands out in a long trace.
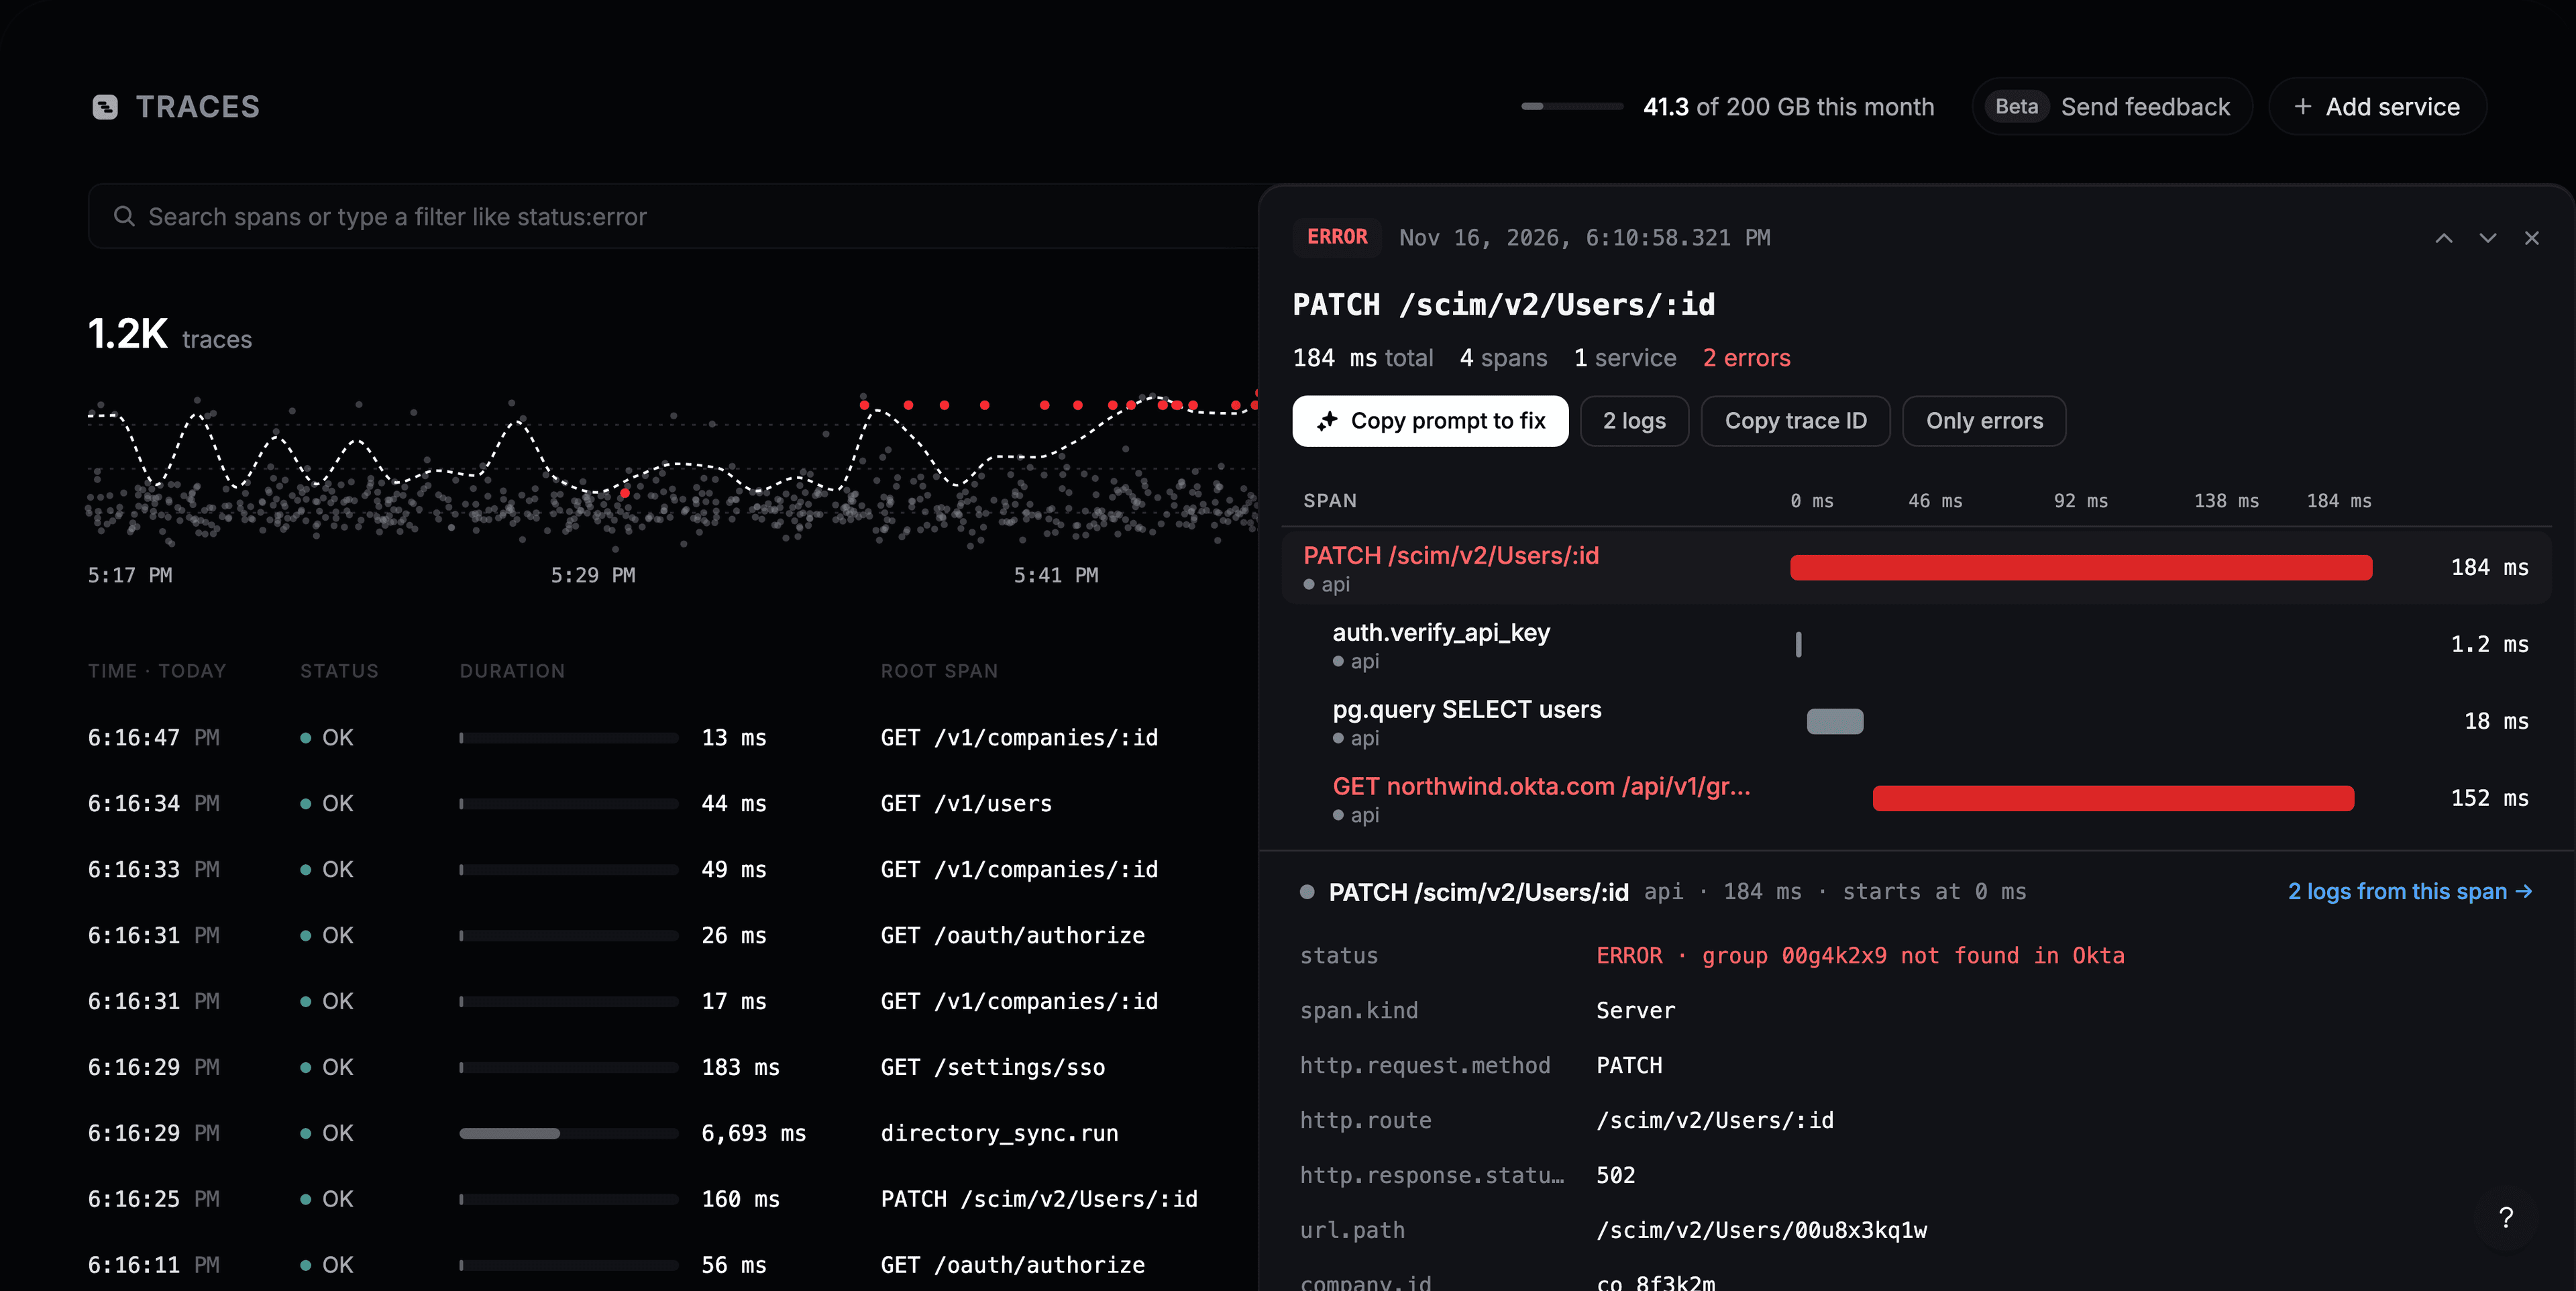
Copy prompt to fix copies a description of the failing request: the spans, their errors and attributes. Paste it into your coding agent, in your app’s project, and it has what it needs to find the cause.