Dashboards
A dashboard puts the numbers you check every day on one page: request rate, errors, latency, the latest failures. You don’t have to build it chart by chart. Describe what you want to see, and Instatus builds it from your logs, traces and metrics.
Open Observability → Dashboards on your status page.
Create your first dashboard
The first time you open Dashboards, you have three ways to start:
- Describe it. Type what you want to watch, such as “How is checkout doing? Latency, errors and failed Stripe calls”, and click Build dashboard.
- Start from one made for your services. Instatus suggests dashboards based on the services, routes and metrics it has seen, such as the health of a service or API latency by route.
- Start with a blank dashboard and add charts yourself.
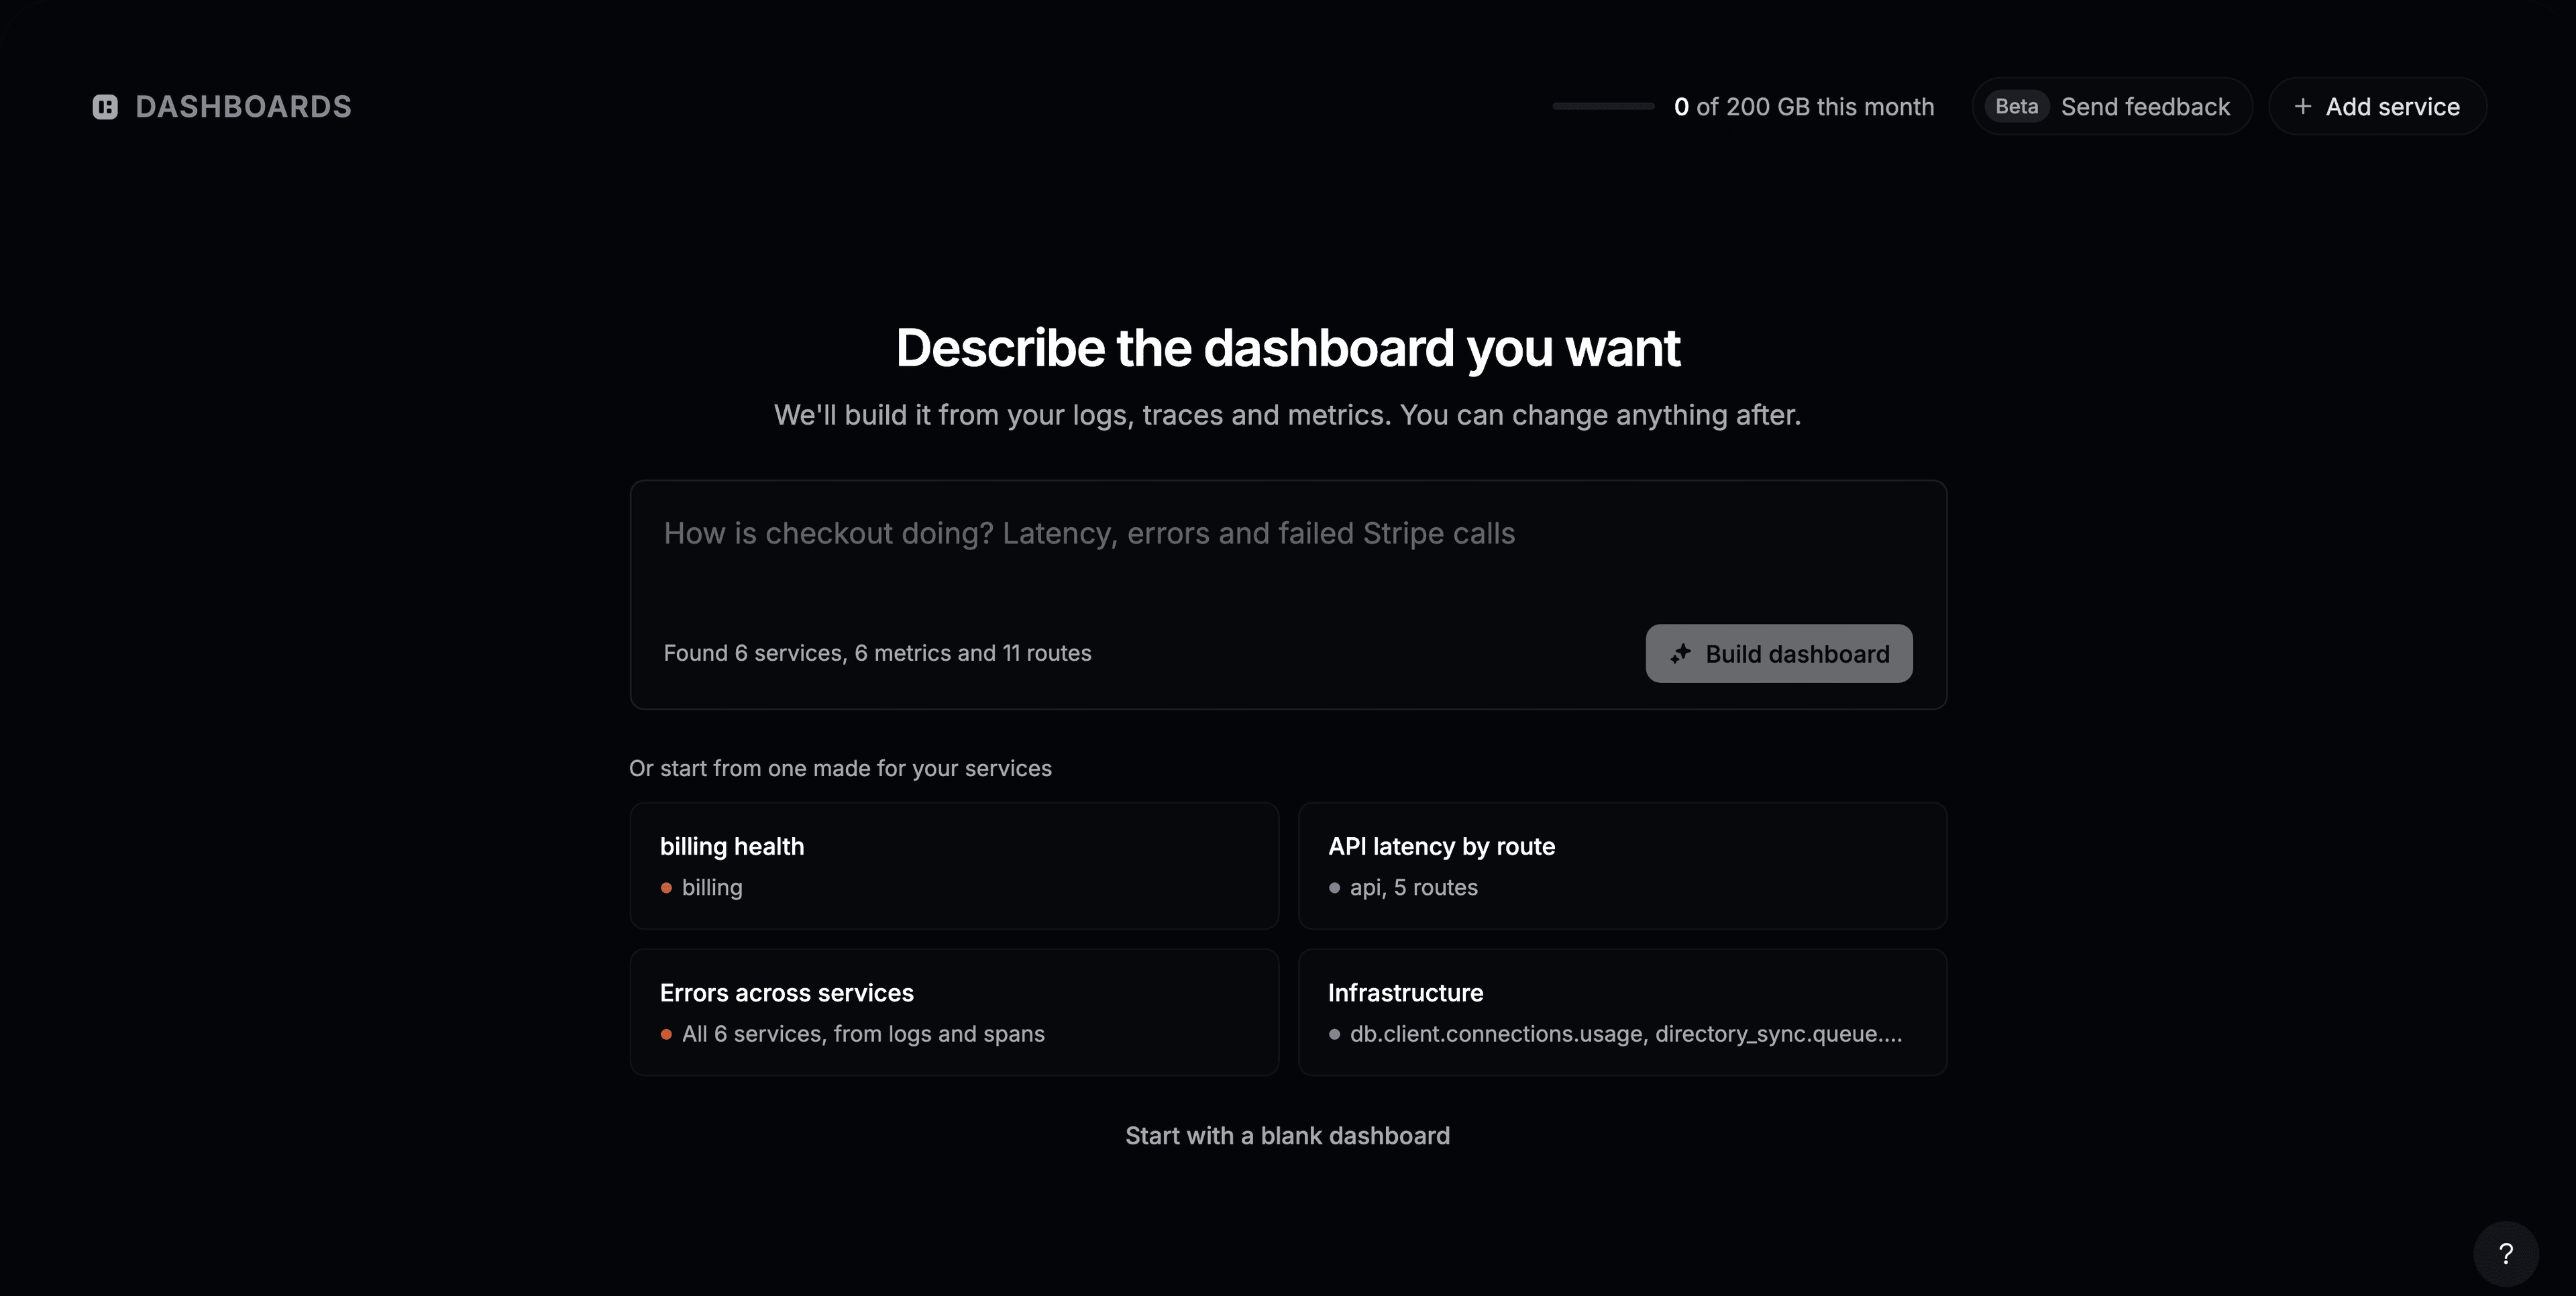
Whichever you pick, you can change everything afterwards.
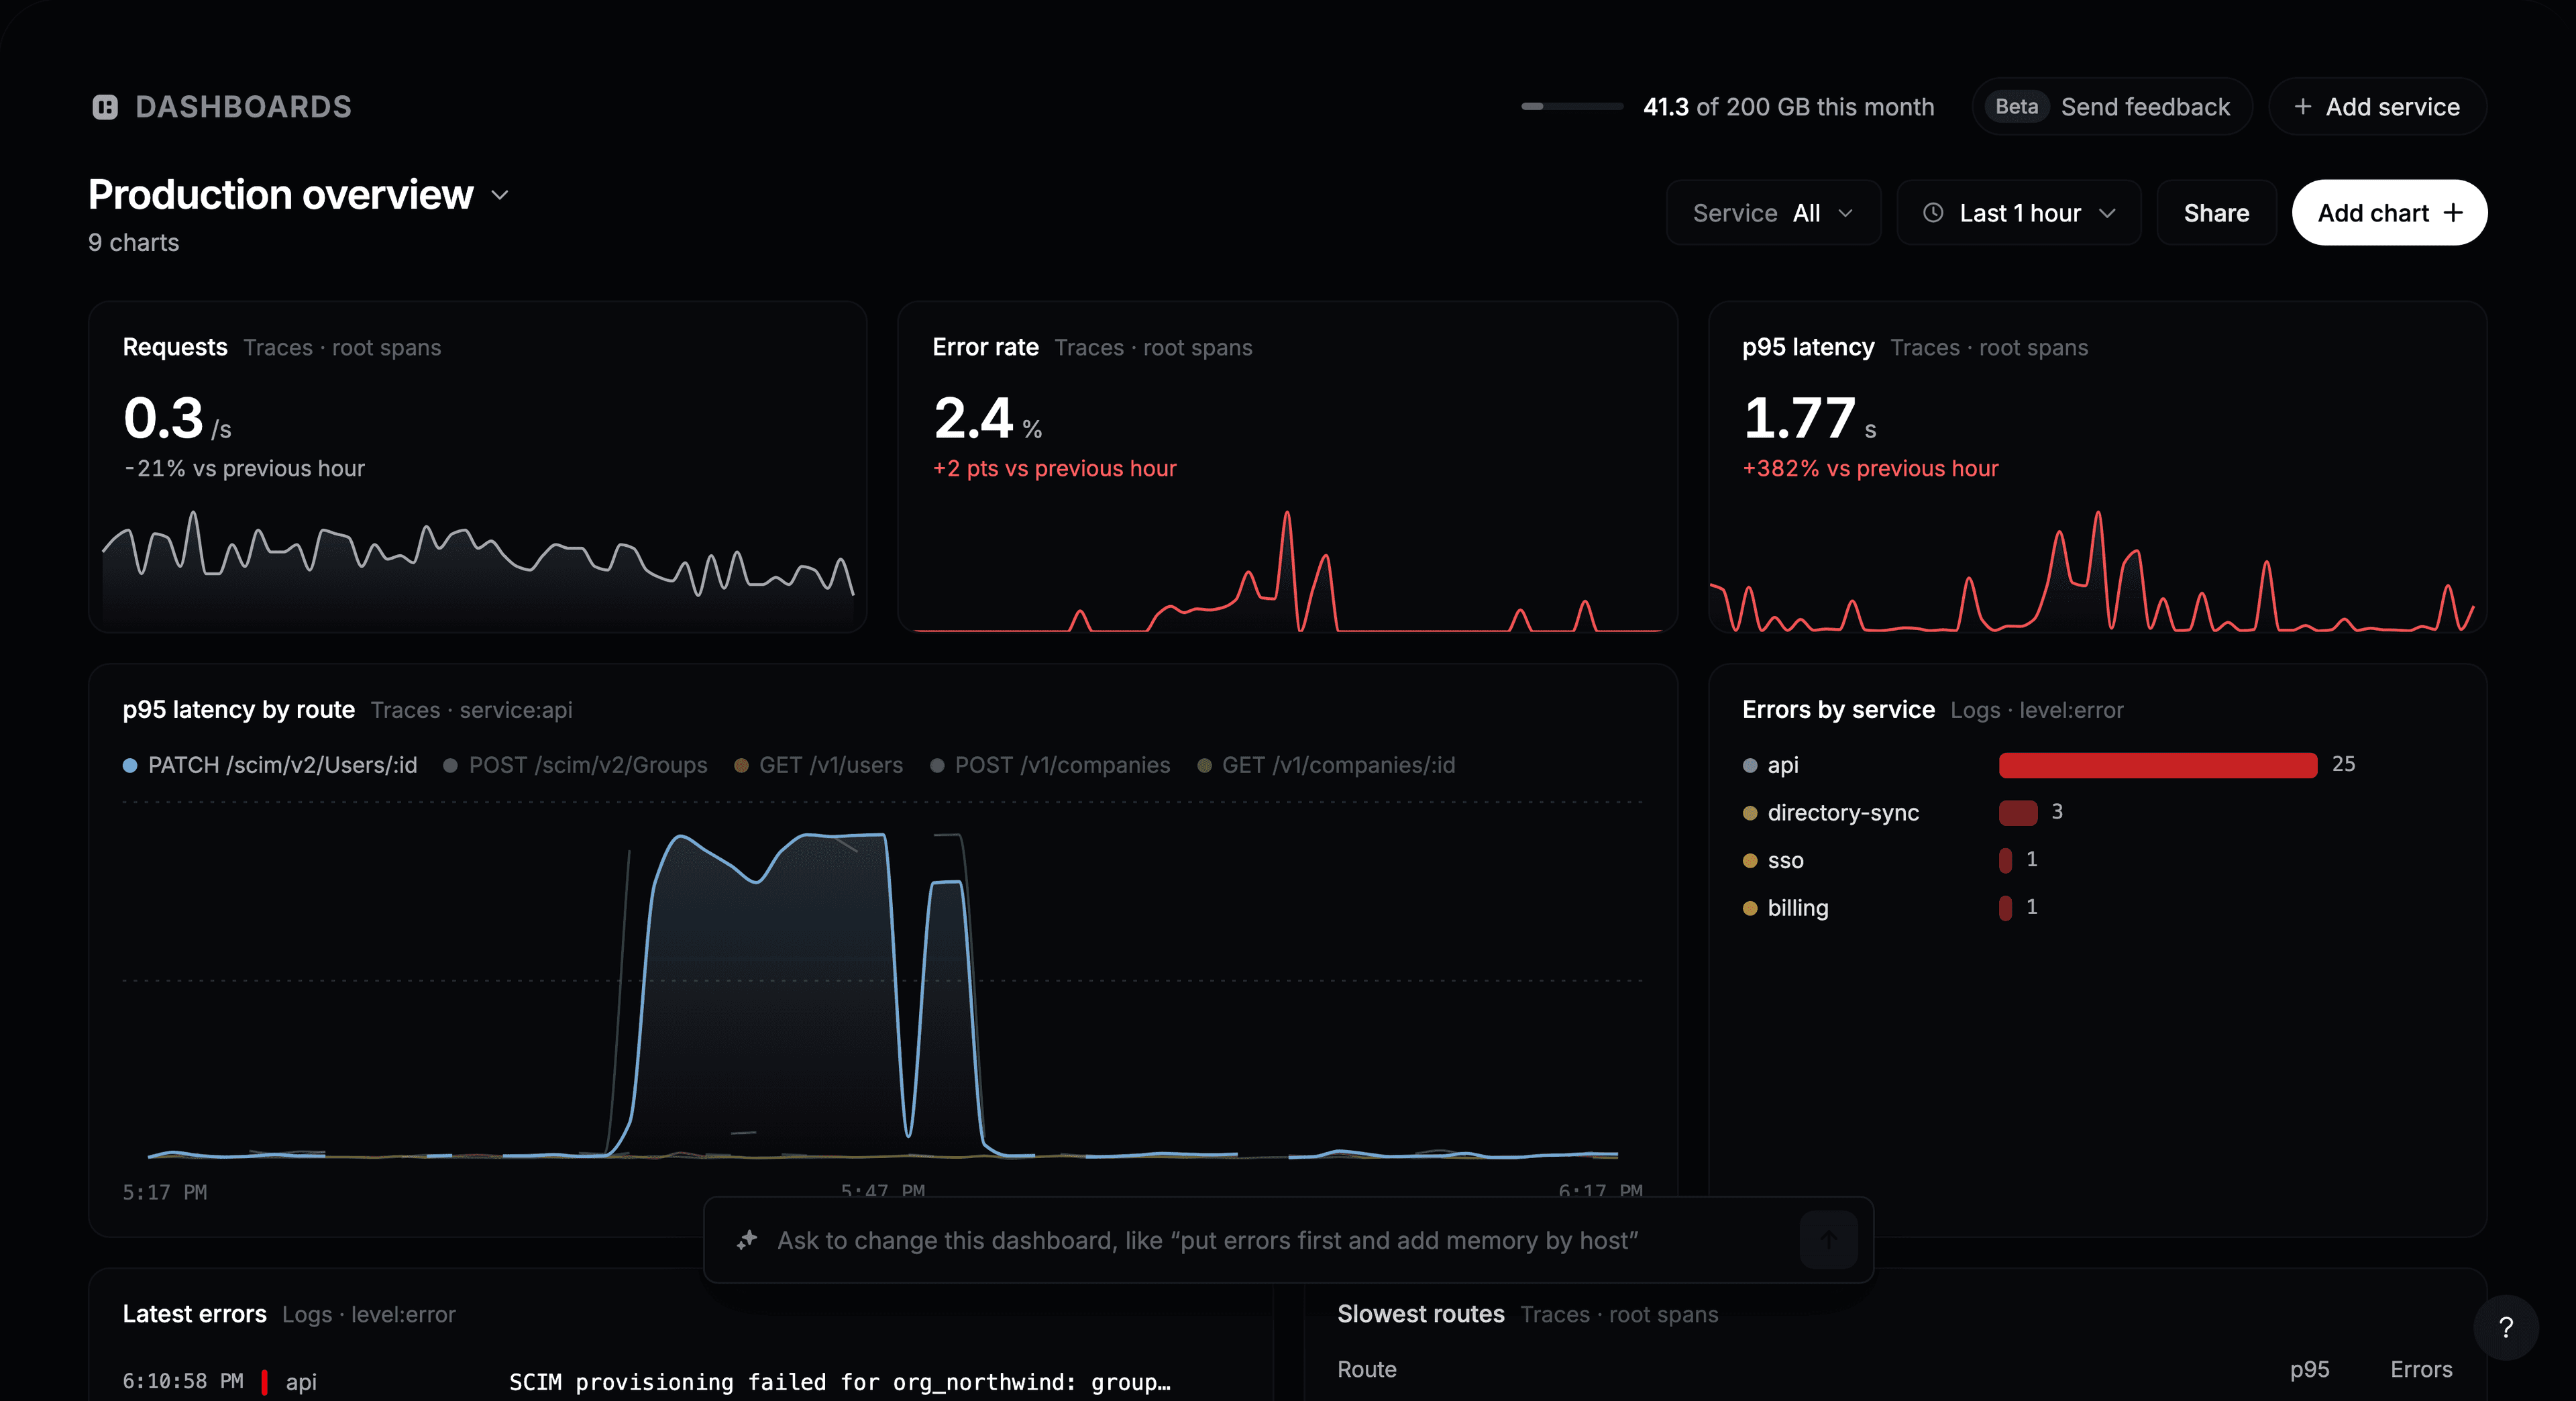
Add a chart
- Click Add chart.
- Describe the chart, such as “p95 latency of POST /charges by service”, and press Enter. Or click one of the suggestions below the box.
- Check the preview, then click Add to dashboard.
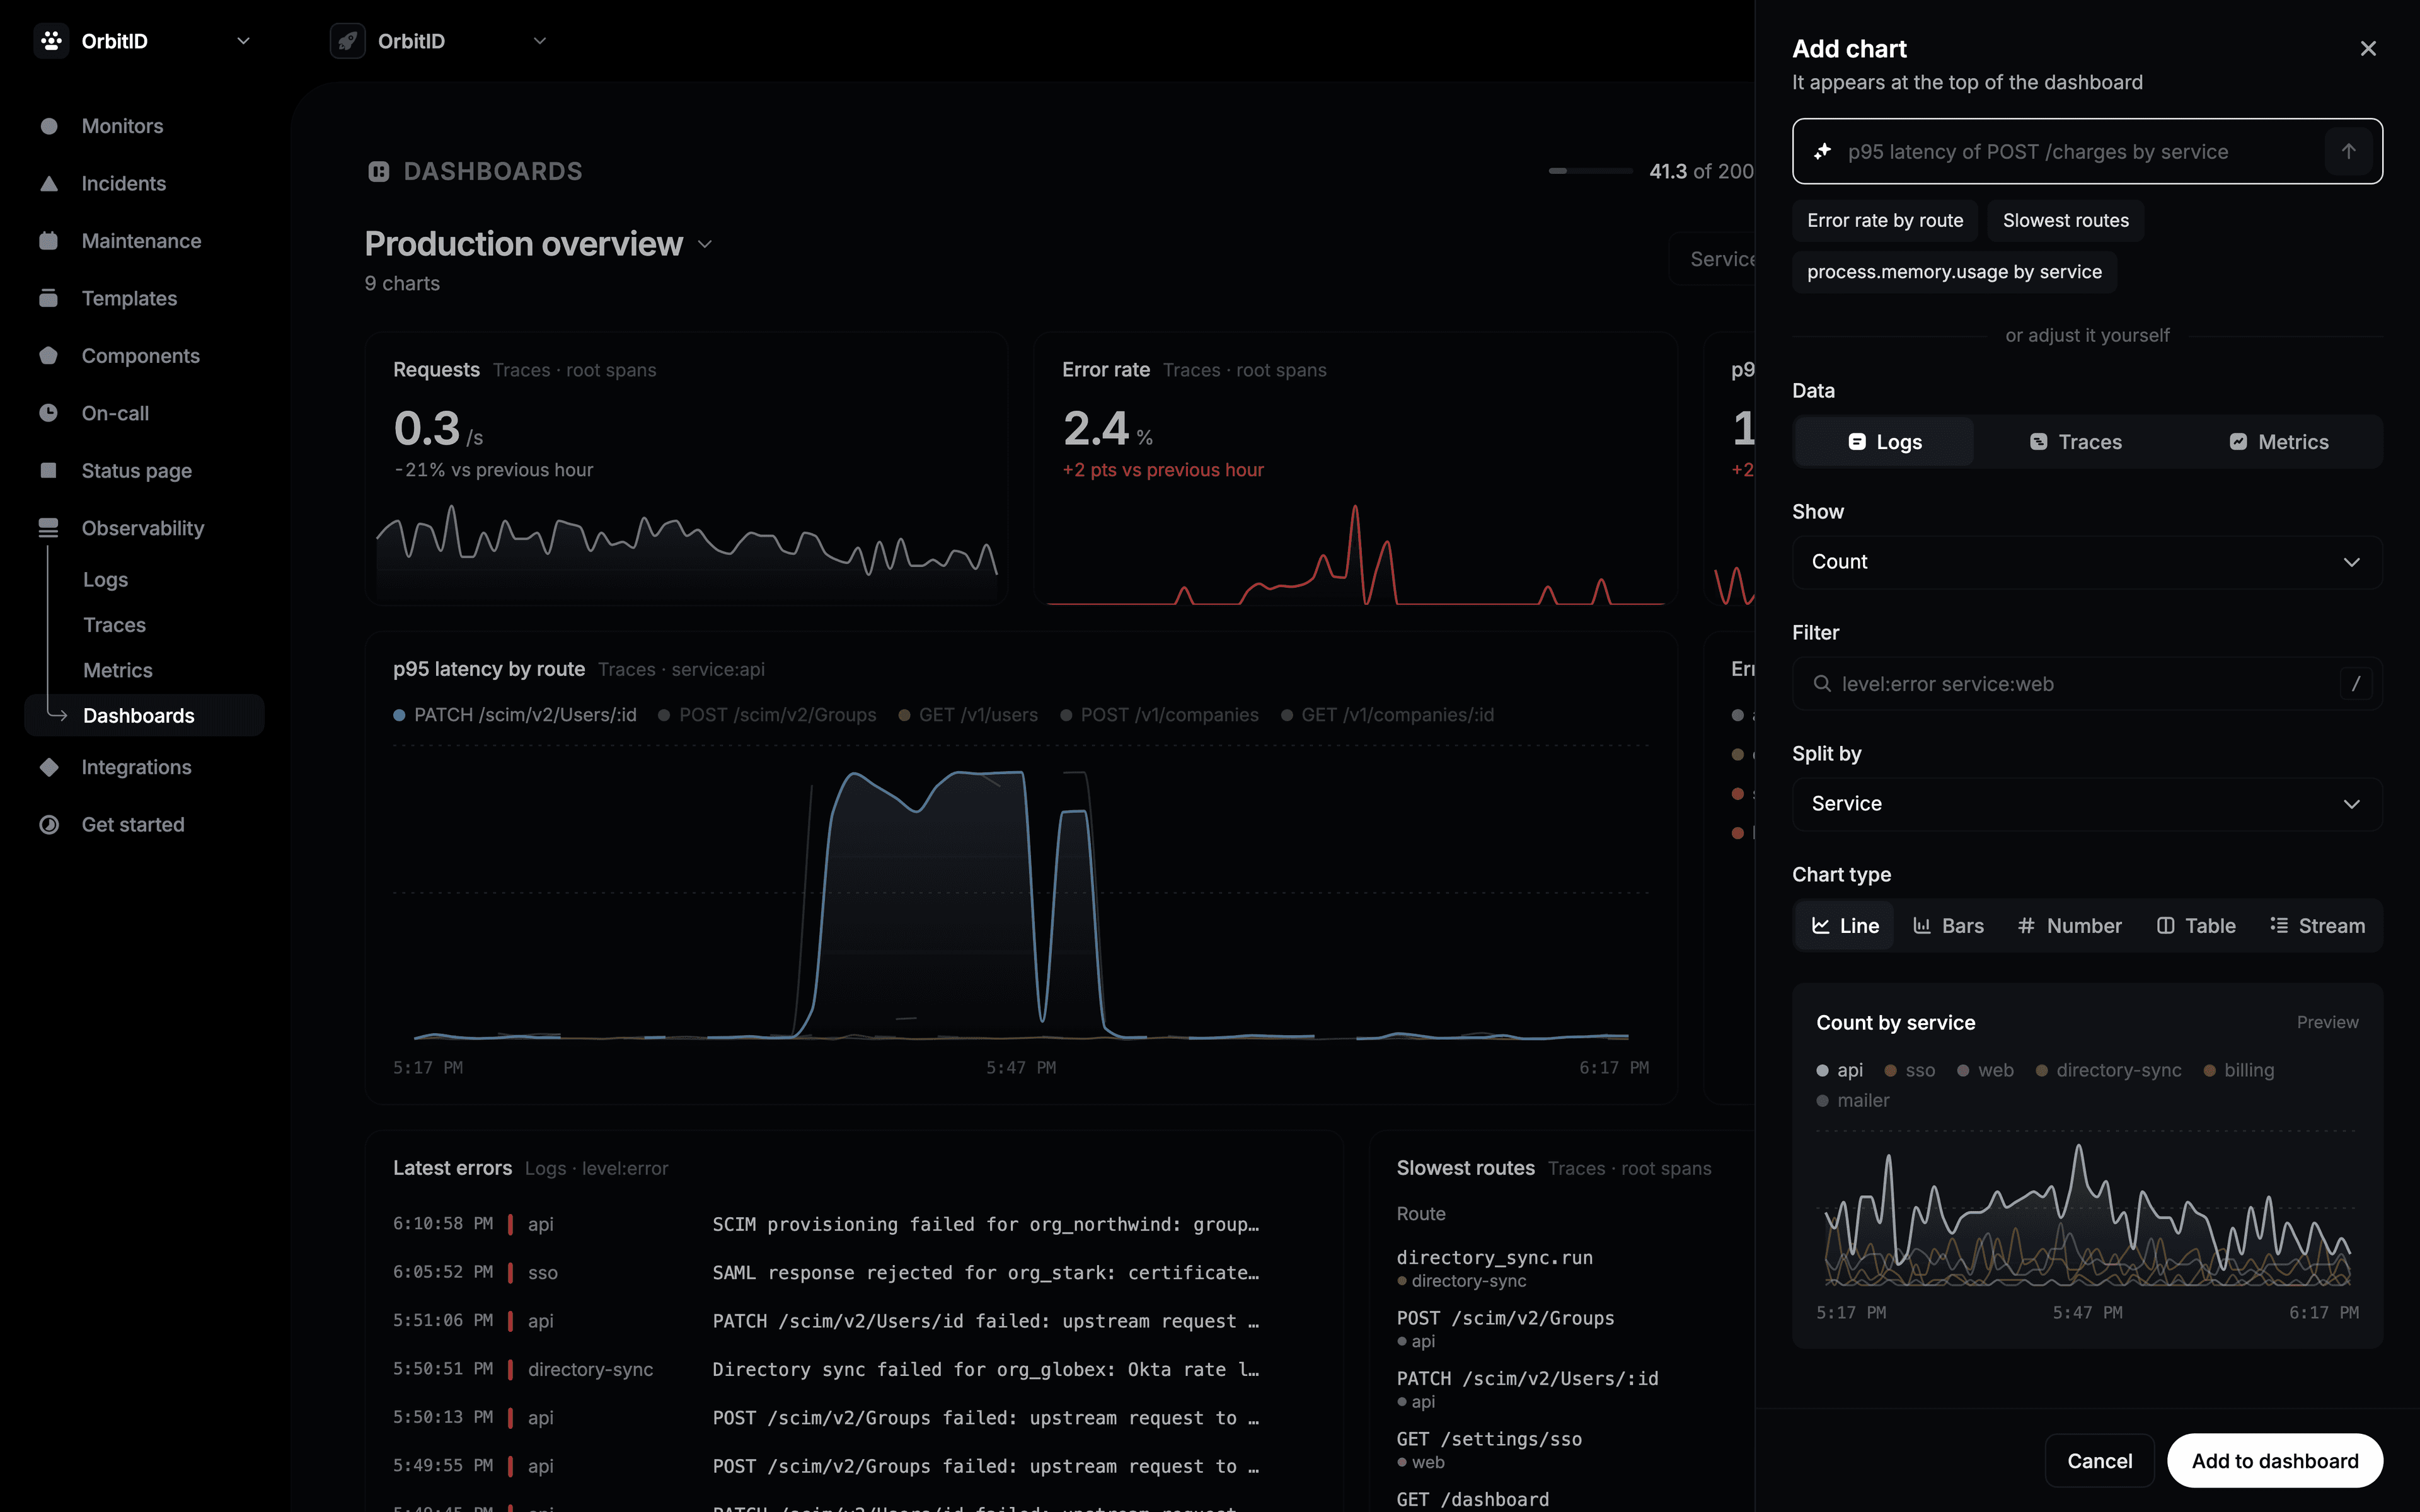
To build the chart yourself instead, set the fields under or adjust it yourself:
| Field | What it does |
|---|---|
| Data | Logs, Traces or a Metric. |
| Show | What to count: count, per second, error rate, p50, p95, p99, average, or a metric’s value. |
| Filter | Which data to include, written like a search, such as level:error service:web. |
| Split by | One line or bar per service, route, level or status, or nothing. |
| Chart type | Line, Bars, Number, Table, or Stream for a live list of logs. |
The new chart appears at the top of the dashboard.
Change a dashboard
- Move a chart by dragging its title. Resize it from its bottom-right corner.
- Point at a chart to see its actions: expand, Edit, Duplicate and Remove. A removed chart comes back with Undo.
- Edit with AI: describe a change to one chart, such as “only 5xx errors”.
- To change the whole dashboard, type in the box at the bottom, such as “put errors first and add memory by host”.
- Click the dashboard name to rename it, delete it, switch to another one, or choose New dashboard.
Use a dashboard
- Service shows every chart for one service only.
- The time range applies to every chart. Each number is compared with the period before.
- Point at a line to read its values. Click to pin them, drag to zoom in.
- Click a row or a point to open the matching logs or traces.
- Share copies the dashboard’s link. Teammates with access to the page can open it.
Limits
| Plan | Dashboards | AI chart requests per month |
|---|---|---|
| Free | 3 | 25 |
| Pro | 20 | 300 |
| Business | Unlimited | 3,000 |
| Enterprise | Unlimited | 3,000 |
An AI chart request is one description sent: building a dashboard, adding or editing a chart with a sentence, or changing the dashboard from the box at the bottom. When you run out, you can still add and edit charts by hand. The count resets on the 1st of each month.