Send data
Instatus receives logs, traces and metrics over OpenTelemetry (OTLP over HTTPS). There are two ways to connect an app. Pick one.
Option 1: Copy a prompt
The quickest way, if you use a coding agent such as Claude Code, Cursor or Copilot.
- Open Observability on your status page.
- Under Include, tick what you want to send: Logs, Traces, Metrics. Tick Starter dashboard too if you want ready-made dashboards for your services later.
- Click Copy prompt.
- Paste it into your coding agent, in your app’s project.
- Put your API key in the
INSTATUS_API_KEYenvironment variable, then run the test the agent suggests.
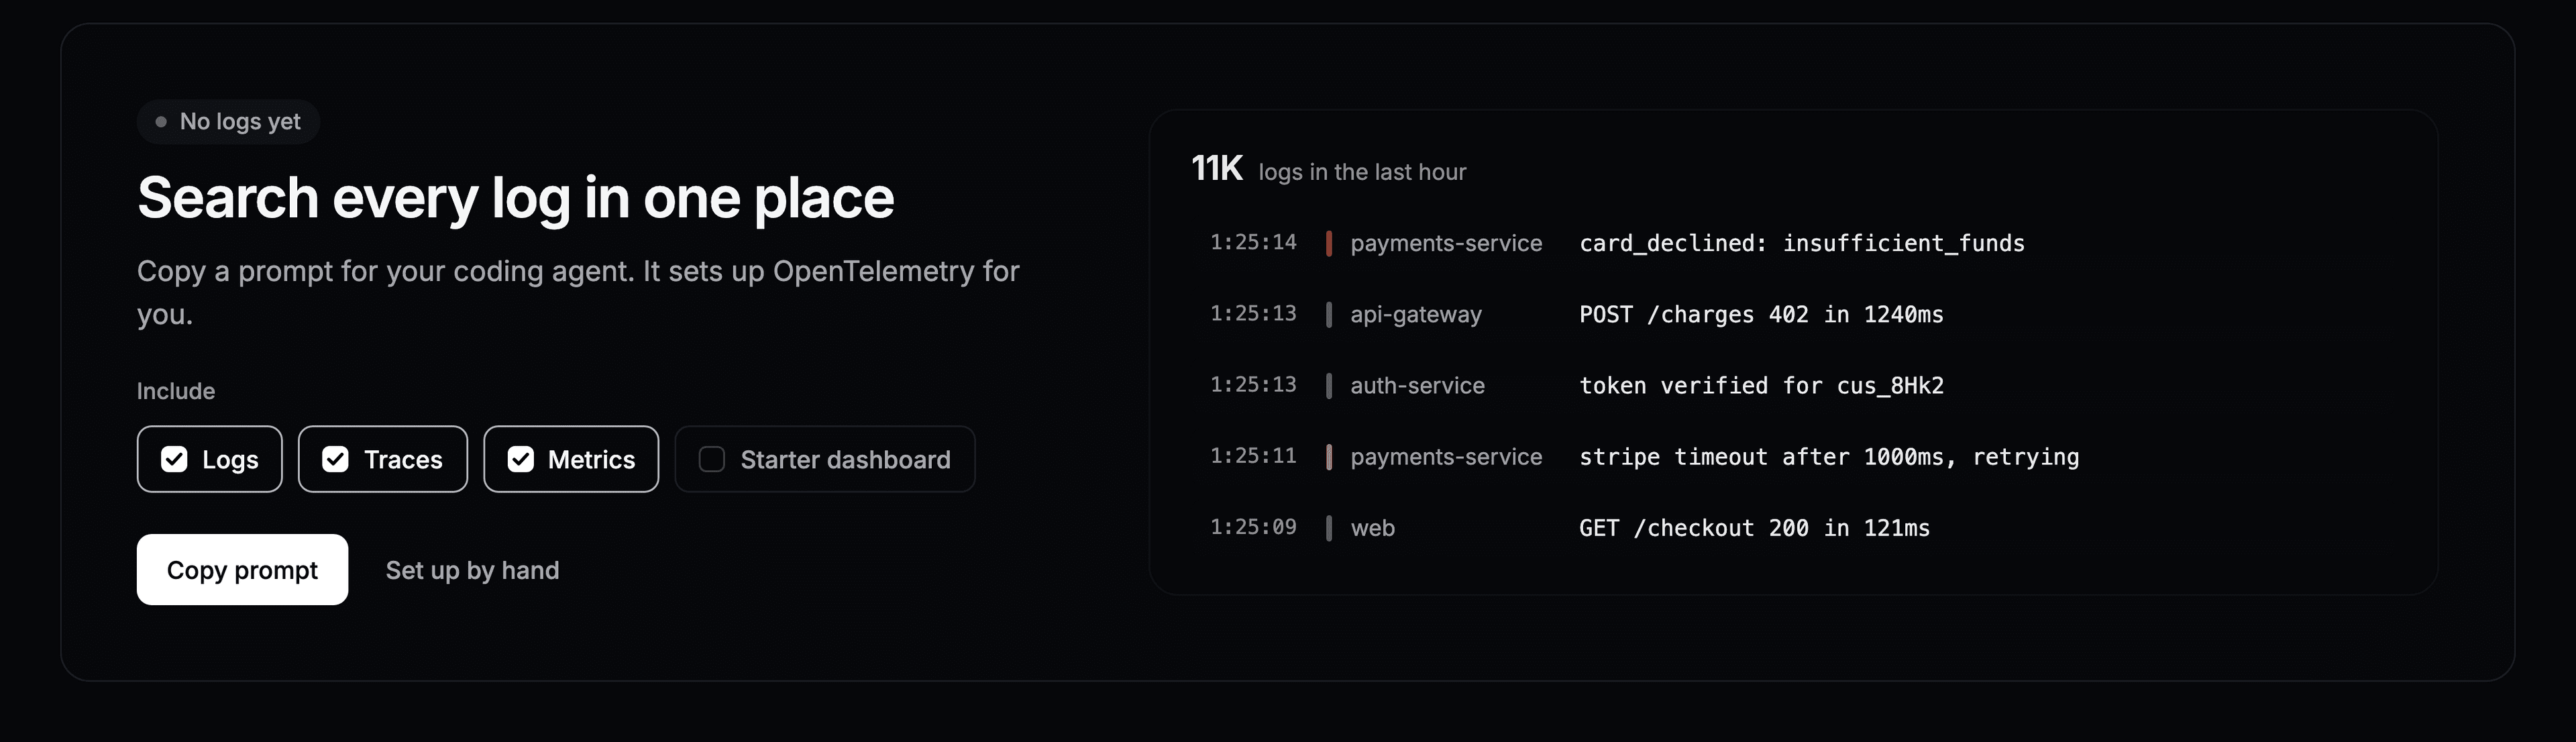
The prompt tells the agent to use the official OpenTelemetry SDK for your language, keep your existing logging library, read the key from an environment variable and never commit it. Your page ID is already in it.
Option 2: Set up by hand
- Open Observability on your status page.
- Click Set up by hand.
- Pick your language: Node.js, Python, Go, Java, .NET, Ruby, PHP, or the OpenTelemetry Collector.
- Copy the Install command and run it, then copy the Configure code into your app.
- Set the
INSTATUS_API_KEYenvironment variable to your API key and start your app.
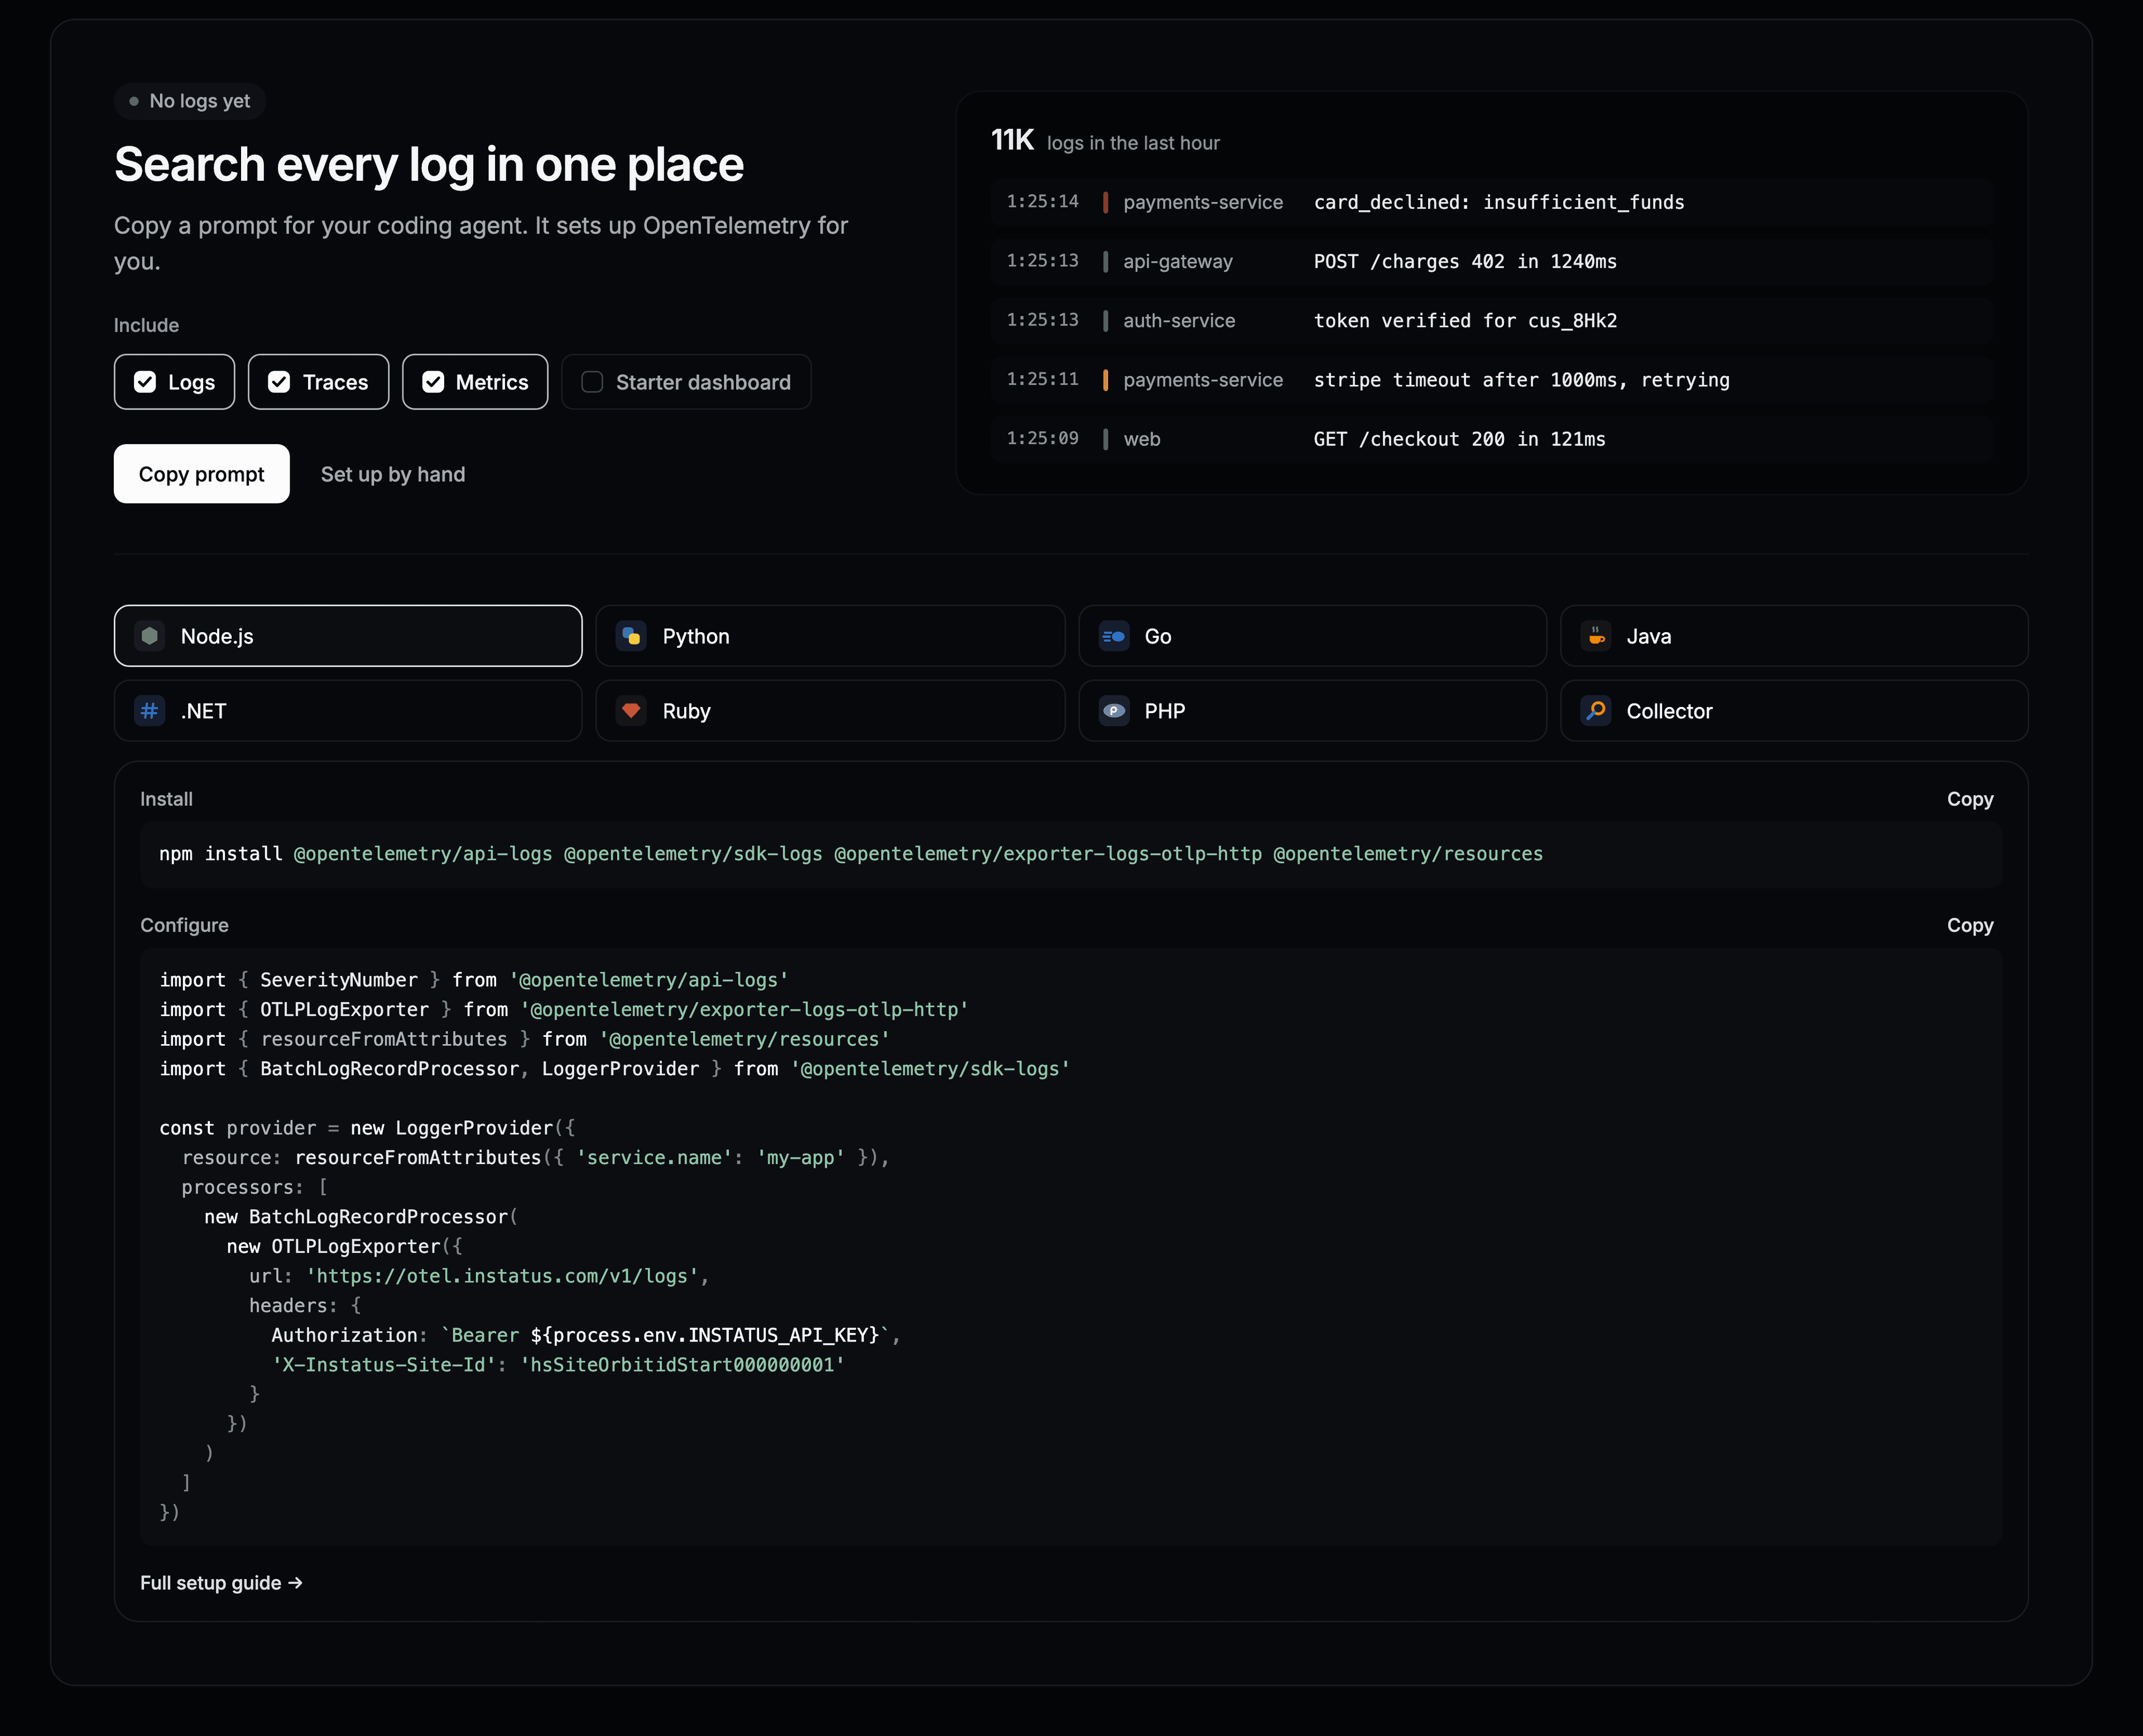
The code in the dashboard already has your page ID filled in. The same examples are below if you’d rather copy them from here.
What every request needs
| What | Value |
|---|---|
| Endpoint | https://otel.instatus.com. Logs go to /v1/logs, traces to /v1/traces, metrics to /v1/metrics. |
Authorization | Bearer <API_KEY>, with the key of an owner, admin or editor of the page. |
X-Instatus-Site-Id | The ID of the status page the data belongs to. |
| Protocol | OTLP over HTTP, as protobuf or JSON. If your SDK defaults to gRPC, switch it to HTTP. |
Your API key gives access to your whole account. Keep it on your servers, in an environment variable. Never put it in a browser, a mobile app or a public repository.
Find your API key
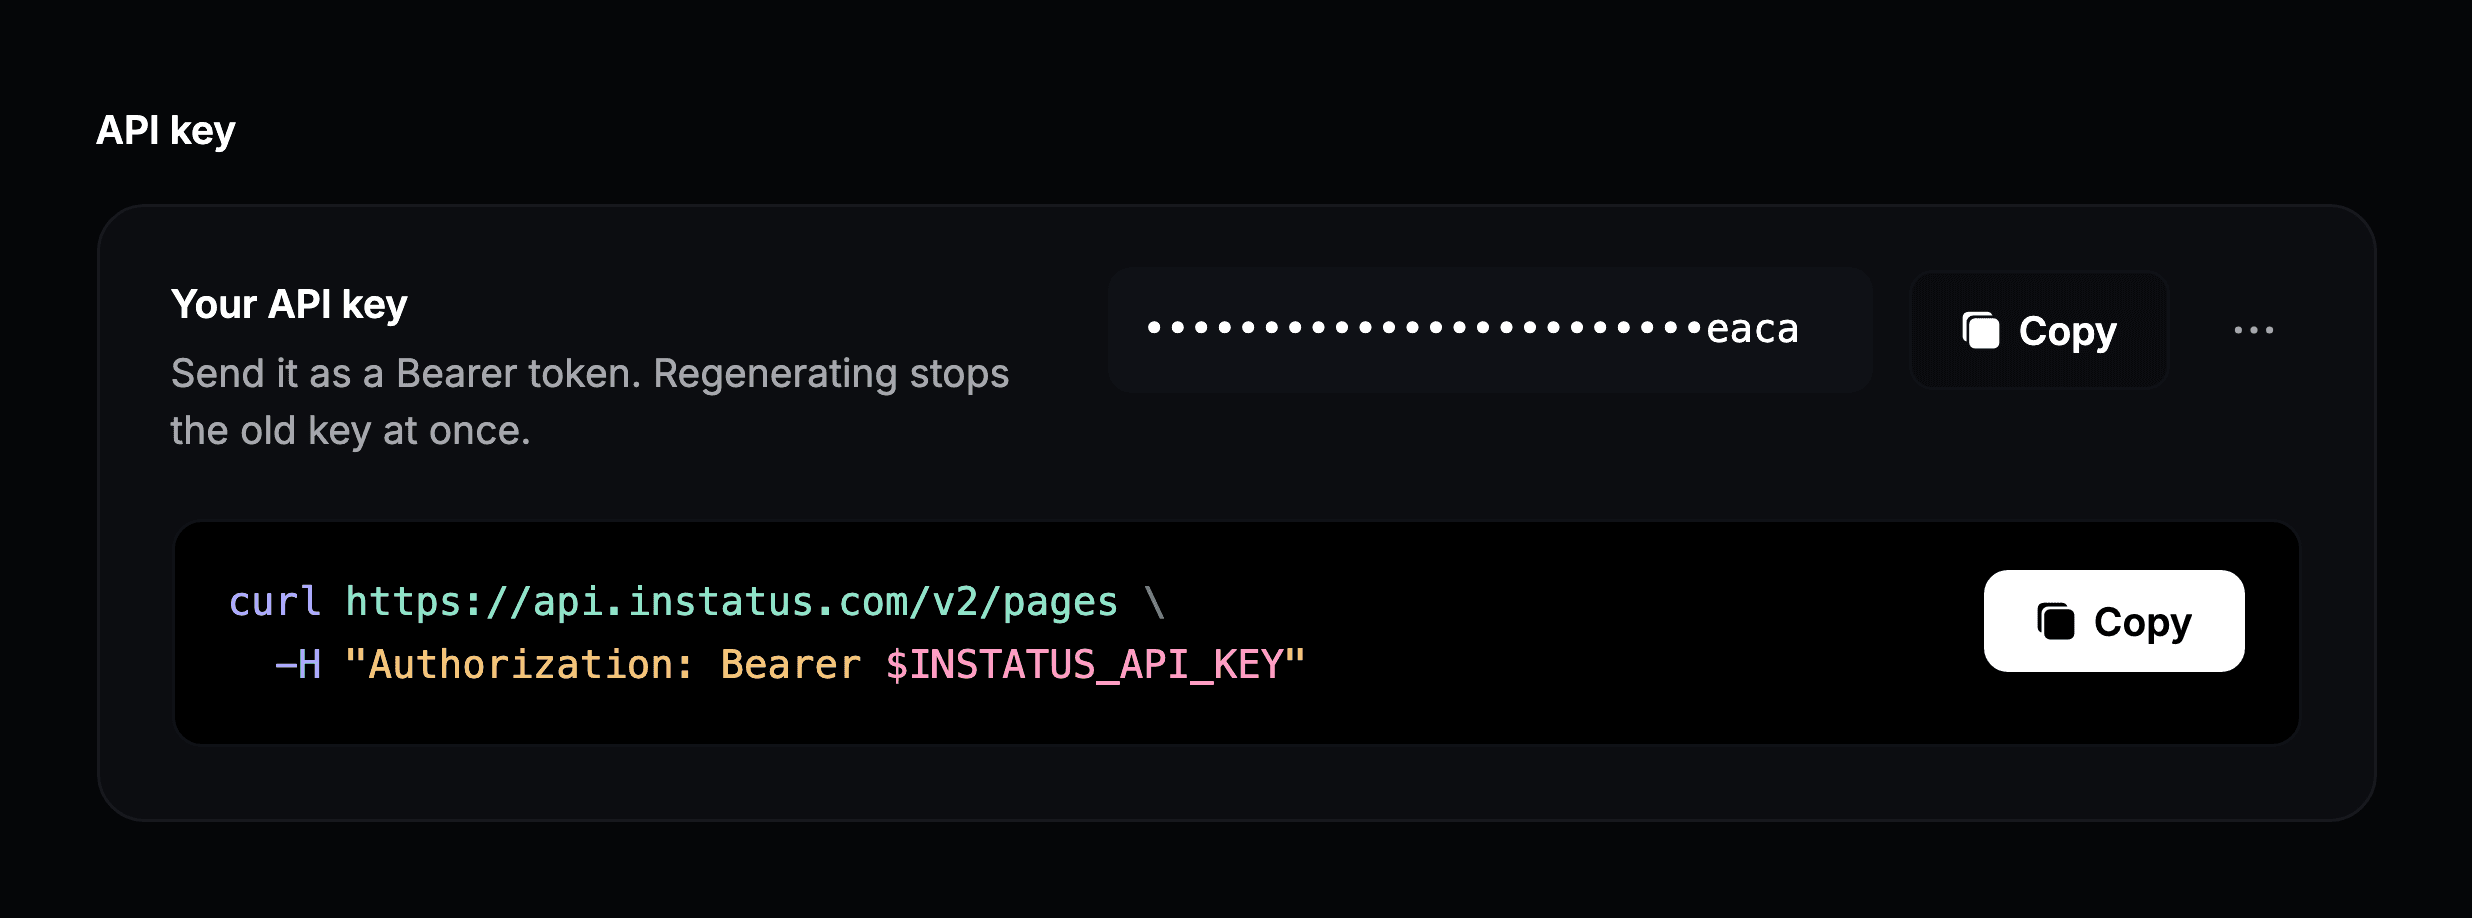
Open your avatar menu, choose User settings, then Developer, or go straight to Developer settings. Click Copy next to the key.
Find your page ID
You rarely need to: the prompt and the code in the dashboard already contain it. To copy it yourself, right-click the project name at the top of the dashboard and choose Copy Project ID.

Send a test log
One request from a terminal is enough to check your key and page ID:
curl -X POST https://otel.instatus.com/v1/logs \-H "Authorization: Bearer $INSTATUS_API_KEY" \-H "X-Instatus-Site-Id: $INSTATUS_PAGE_ID" \-H "Content-Type: application/json" \-d '{"resourceLogs": [{"resource": {"attributes": [{ "key": "service.name", "value": { "stringValue": "api" } }]},"scopeLogs": [{"logRecords": [{"timeUnixNano": "'$(date +%s)'000000000","severityText": "INFO","body": { "stringValue": "Hello from Instatus" }}]}]}]}'
A 200 response means the log was accepted. Open Observability → Logs, and it is there within a few seconds.
Any language, no code changes
Every OpenTelemetry SDK reads the same environment variables. With them, auto-instrumentation sends traces, metrics and logs without touching your code:
export OTEL_SERVICE_NAME="api"export OTEL_EXPORTER_OTLP_ENDPOINT="https://otel.instatus.com"export OTEL_EXPORTER_OTLP_PROTOCOL="http/protobuf"export OTEL_EXPORTER_OTLP_HEADERS="Authorization=Bearer%20${INSTATUS_API_KEY},X-Instatus-Site-Id=${INSTATUS_PAGE_ID}"export OTEL_TRACES_EXPORTER="otlp"export OTEL_METRICS_EXPORTER="otlp"export OTEL_LOGS_EXPORTER="otlp"
The space after Bearer is written as %20, because the headers variable is URL-encoded. Then start your app with the auto-instrumentation for its language:
# Node.jsnpm install @opentelemetry/api @opentelemetry/auto-instrumentations-nodenode --require @opentelemetry/auto-instrumentations-node/register app.js# Pythonpip install opentelemetry-distro opentelemetry-exporter-otlpopentelemetry-bootstrap -a installOTEL_PYTHON_LOGGING_AUTO_INSTRUMENTATION_ENABLED=true opentelemetry-instrument python app.py
Java, .NET, Go, Ruby and PHP have their own auto-instrumentation and read the same variables. See OpenTelemetry’s zero-code guides.
Node.js
To send logs from your code, install the logs SDK:
npm install @opentelemetry/api-logs @opentelemetry/sdk-logs \@opentelemetry/exporter-logs-otlp-http @opentelemetry/resources
Set it up once when your app starts:
import { SeverityNumber } from '@opentelemetry/api-logs'import { OTLPLogExporter } from '@opentelemetry/exporter-logs-otlp-http'import { resourceFromAttributes } from '@opentelemetry/resources'import { BatchLogRecordProcessor, LoggerProvider } from '@opentelemetry/sdk-logs'const provider = new LoggerProvider({resource: resourceFromAttributes({ 'service.name': 'api' }),processors: [new BatchLogRecordProcessor(new OTLPLogExporter({url: 'https://otel.instatus.com/v1/logs',headers: {Authorization: `Bearer ${process.env.INSTATUS_API_KEY}`,'X-Instatus-Site-Id': process.env.INSTATUS_PAGE_ID}}))]})const logger = provider.getLogger('api')logger.emit({severityNumber: SeverityNumber.ERROR,severityText: 'ERROR',body: 'Payment failed: card declined',attributes: { 'customer.id': 'cus_123', route: '/v2/charges' }})process.on('beforeExit', () => provider.shutdown())
Already logging with pino or winston? Keep them. pino-opentelemetry-transport and @opentelemetry/winston-transport send every existing log line as it is.
Python
pip install opentelemetry-sdk opentelemetry-exporter-otlp-proto-http
The SDK plugs into Python’s logging module, so your existing logging calls are sent as they are:
import loggingimport osfrom opentelemetry._logs import set_logger_providerfrom opentelemetry.exporter.otlp.proto.http._log_exporter import OTLPLogExporterfrom opentelemetry.sdk._logs import LoggerProvider, LoggingHandlerfrom opentelemetry.sdk._logs.export import BatchLogRecordProcessorfrom opentelemetry.sdk.resources import Resourceprovider = LoggerProvider(resource=Resource.create({"service.name": "worker"}))provider.add_log_record_processor(BatchLogRecordProcessor(OTLPLogExporter(endpoint="https://otel.instatus.com/v1/logs",headers={"Authorization": f"Bearer {os.environ['INSTATUS_API_KEY']}","X-Instatus-Site-Id": os.environ["INSTATUS_PAGE_ID"],},)))set_logger_provider(provider)logging.getLogger().addHandler(LoggingHandler(level=logging.INFO, logger_provider=provider))logging.getLogger().setLevel(logging.INFO)logging.warning("Card declined for customer %s", "cus_123")
OpenTelemetry Collector
Already running the OpenTelemetry Collector? Add Instatus as an exporter and leave your apps as they are:
exporters:otlphttp/instatus:endpoint: https://otel.instatus.comheaders:Authorization: Bearer ${env:INSTATUS_API_KEY}X-Instatus-Site-Id: ${env:INSTATUS_PAGE_ID}service:pipelines:logs:receivers: [otlp]processors: [batch]exporters: [otlphttp/instatus]traces:receivers: [otlp]processors: [batch]exporters: [otlphttp/instatus]metrics:receivers: [otlp]processors: [batch]exporters: [otlphttp/instatus]
The exporter adds /v1/logs, /v1/traces and /v1/metrics itself, so the endpoint is the host only. To ship log files, add a filelog receiver to the logs pipeline.
What to send
Instatus reads these fields. Everything else is kept as an attribute you can search and filter on.
| Field | Used for |
|---|---|
service.name (resource) | The Service column and filter. Set it in every app, worker and job. |
body | The log message, matched by free-text search. |
severityText or severityNumber | The level: fatal, error, warn, info, debug or trace. |
traceId and spanId | Links a log to its trace, so you can jump between them. |
| Attributes | Anything you add, such as customer.id or http.route. Each one becomes a filter. |
Attributes starting with instatus. are reserved and replaced when data arrives.
Troubleshooting
| You see | Fix |
|---|---|
401 | Check the key and the X-Instatus-Site-Id header. The key’s owner must be an owner, admin or editor of the page. |
400 | The body isn’t valid OTLP. Check Content-Type and the JSON structure in the test log. |
429 | This month’s data allowance is used up. See plans and limits. |
200, but nothing shows up | Wait a few seconds, then check the time range. A log with a timestamp in the past only shows when the range covers it. |
| Nothing at all | SDKs send in batches. Make sure your app flushes or shuts down the provider before it exits. |
Regenerating your API key in Developer settings stops the old one at once, so update every app that uses it first.