Metrics
Metrics are numbers your services report over time: request duration, memory, CPU, queue depth, anything you count. Instatus shows them biggest change first, so what moved recently is at the top.
Open Observability → Metrics on your status page.
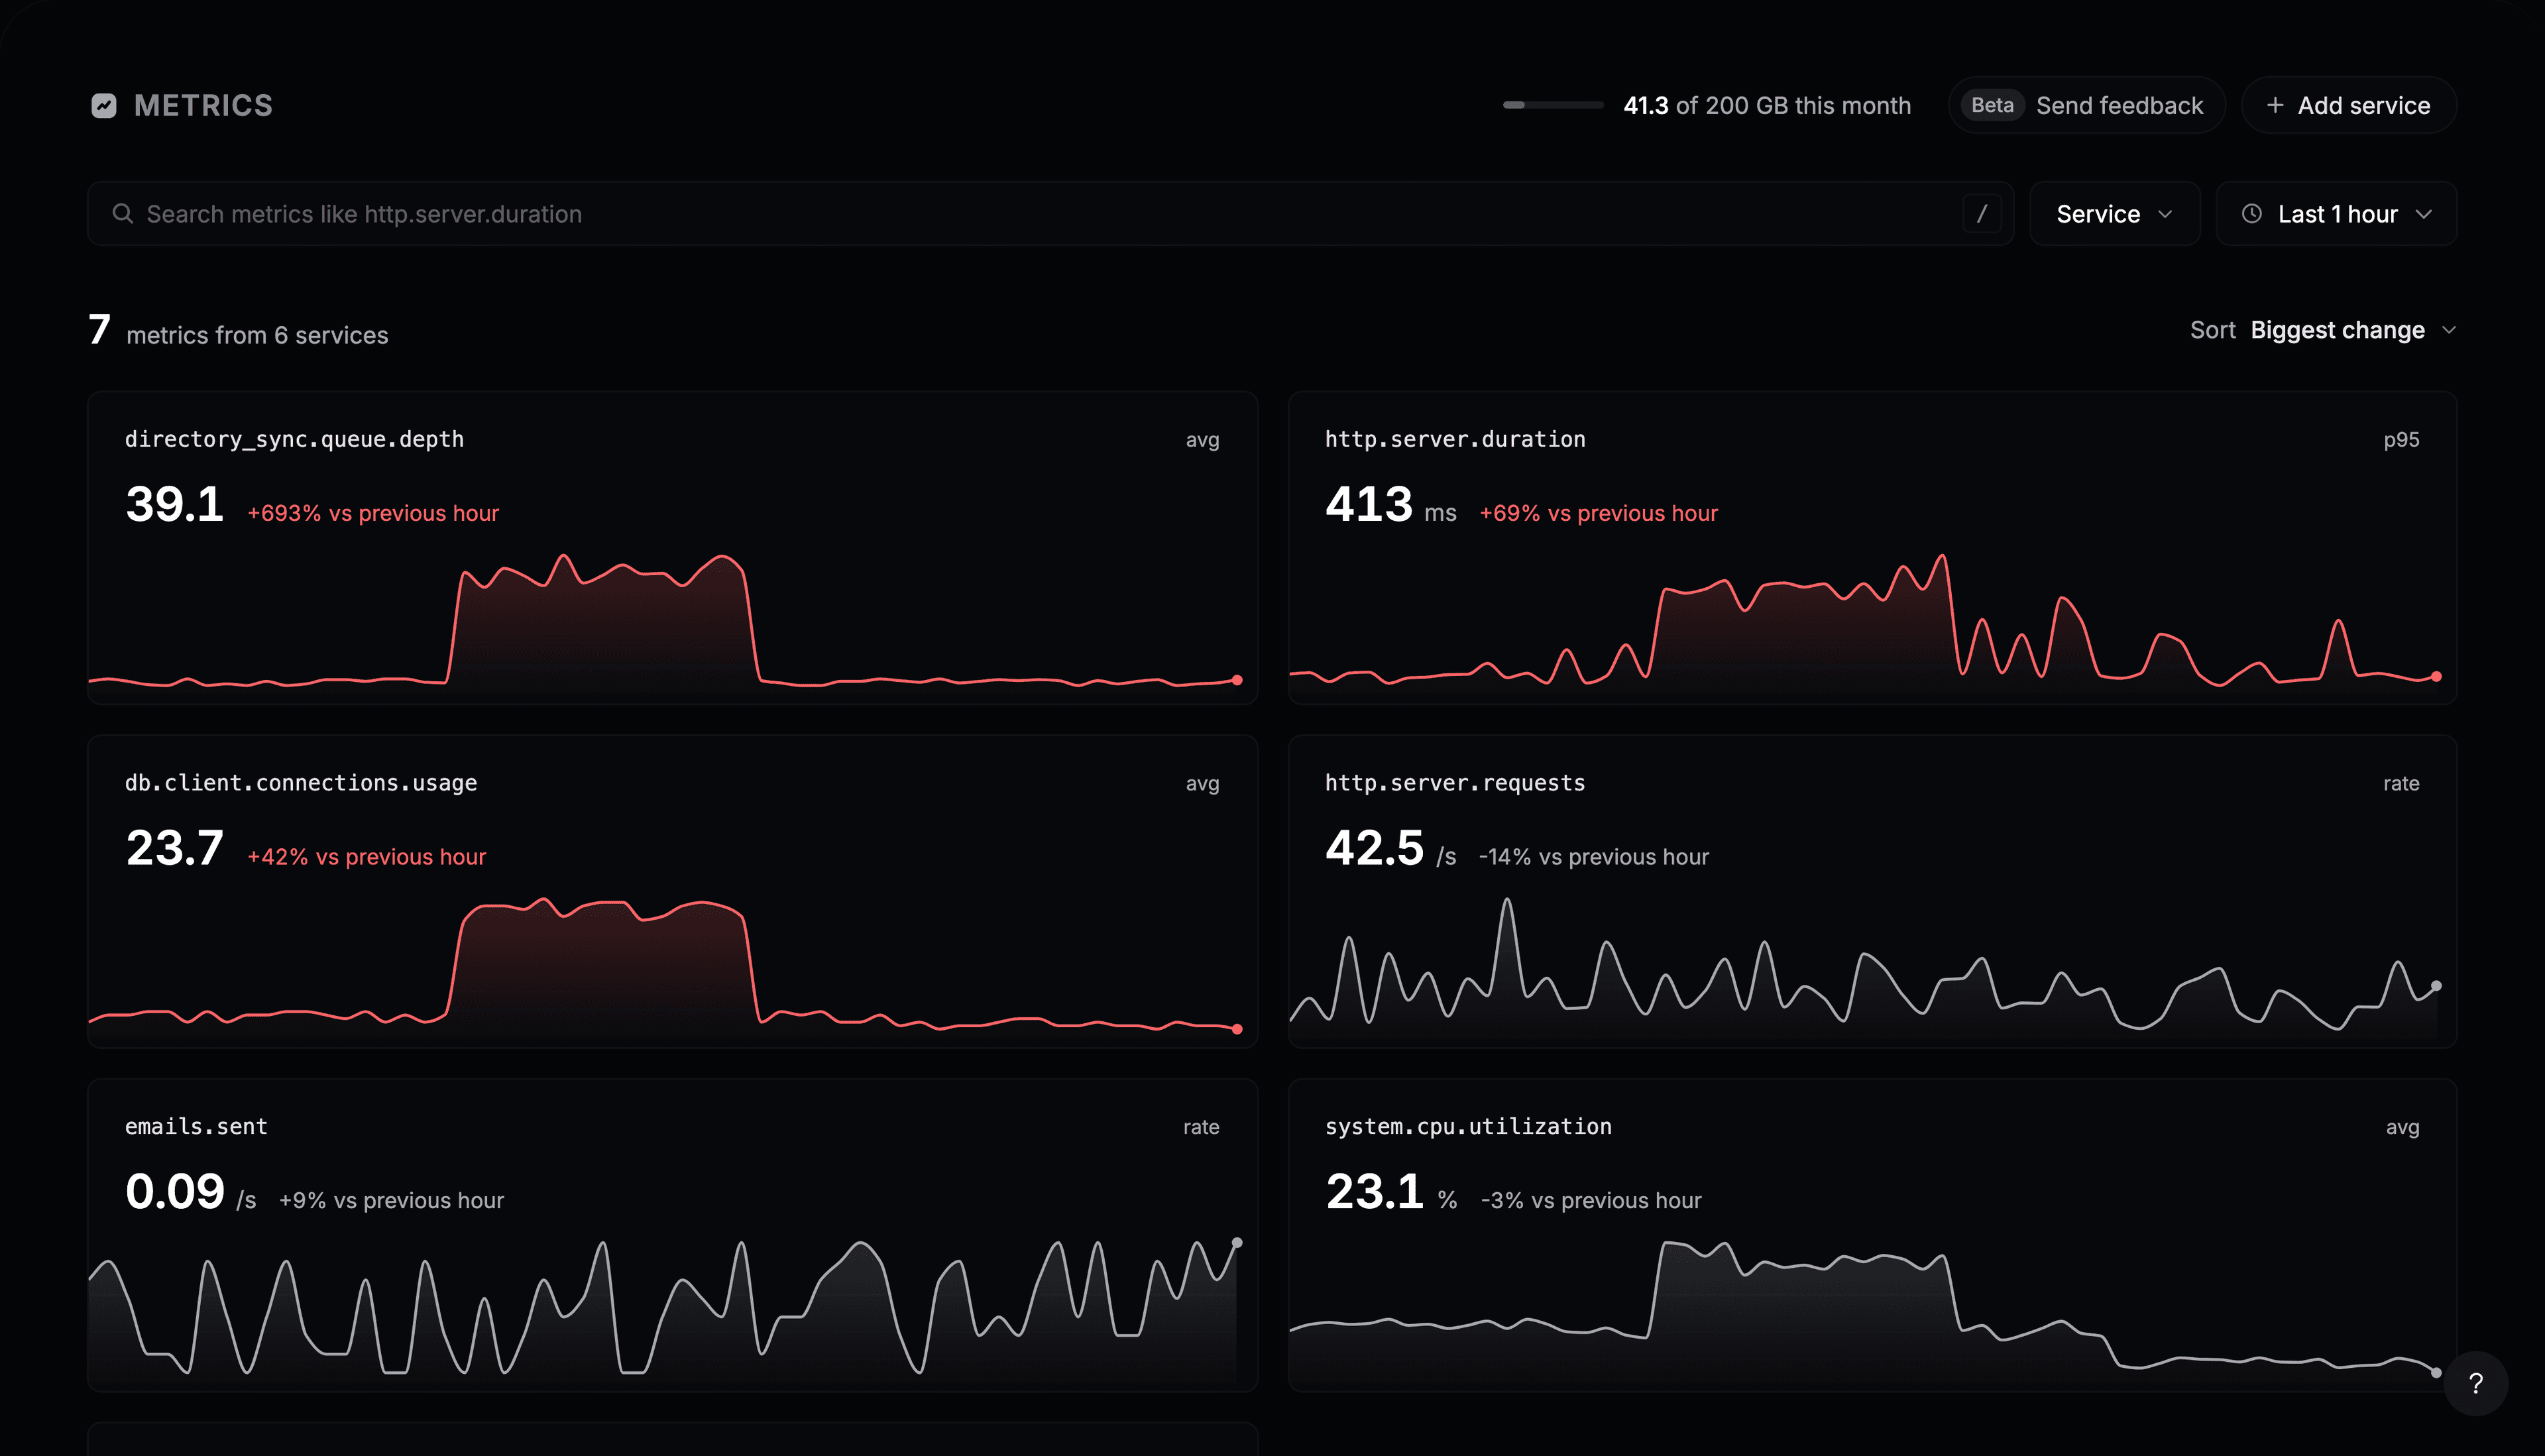
Metrics arrive once your app sends them: tick Metrics when you copy the setup prompt, or use auto-instrumentation, which reports request duration, memory and CPU for you.
Read the cards
Each card shows a metric’s current value and how much it changed against the previous period. With Last 1 hour selected, that’s the hour before. A red change is worth a look.
- Sort switches between Biggest change and Name.
- Service shows only the metrics of one service.
- The search box finds a metric by name, such as
http.server.duration. Press / to jump to it. - The time range sets both the chart and the period it is compared with.
Open a metric
Click a card. The chart shows the metric over the time range, with one line per service, and a table below compares them: the value now, the average, the peak, and the change.
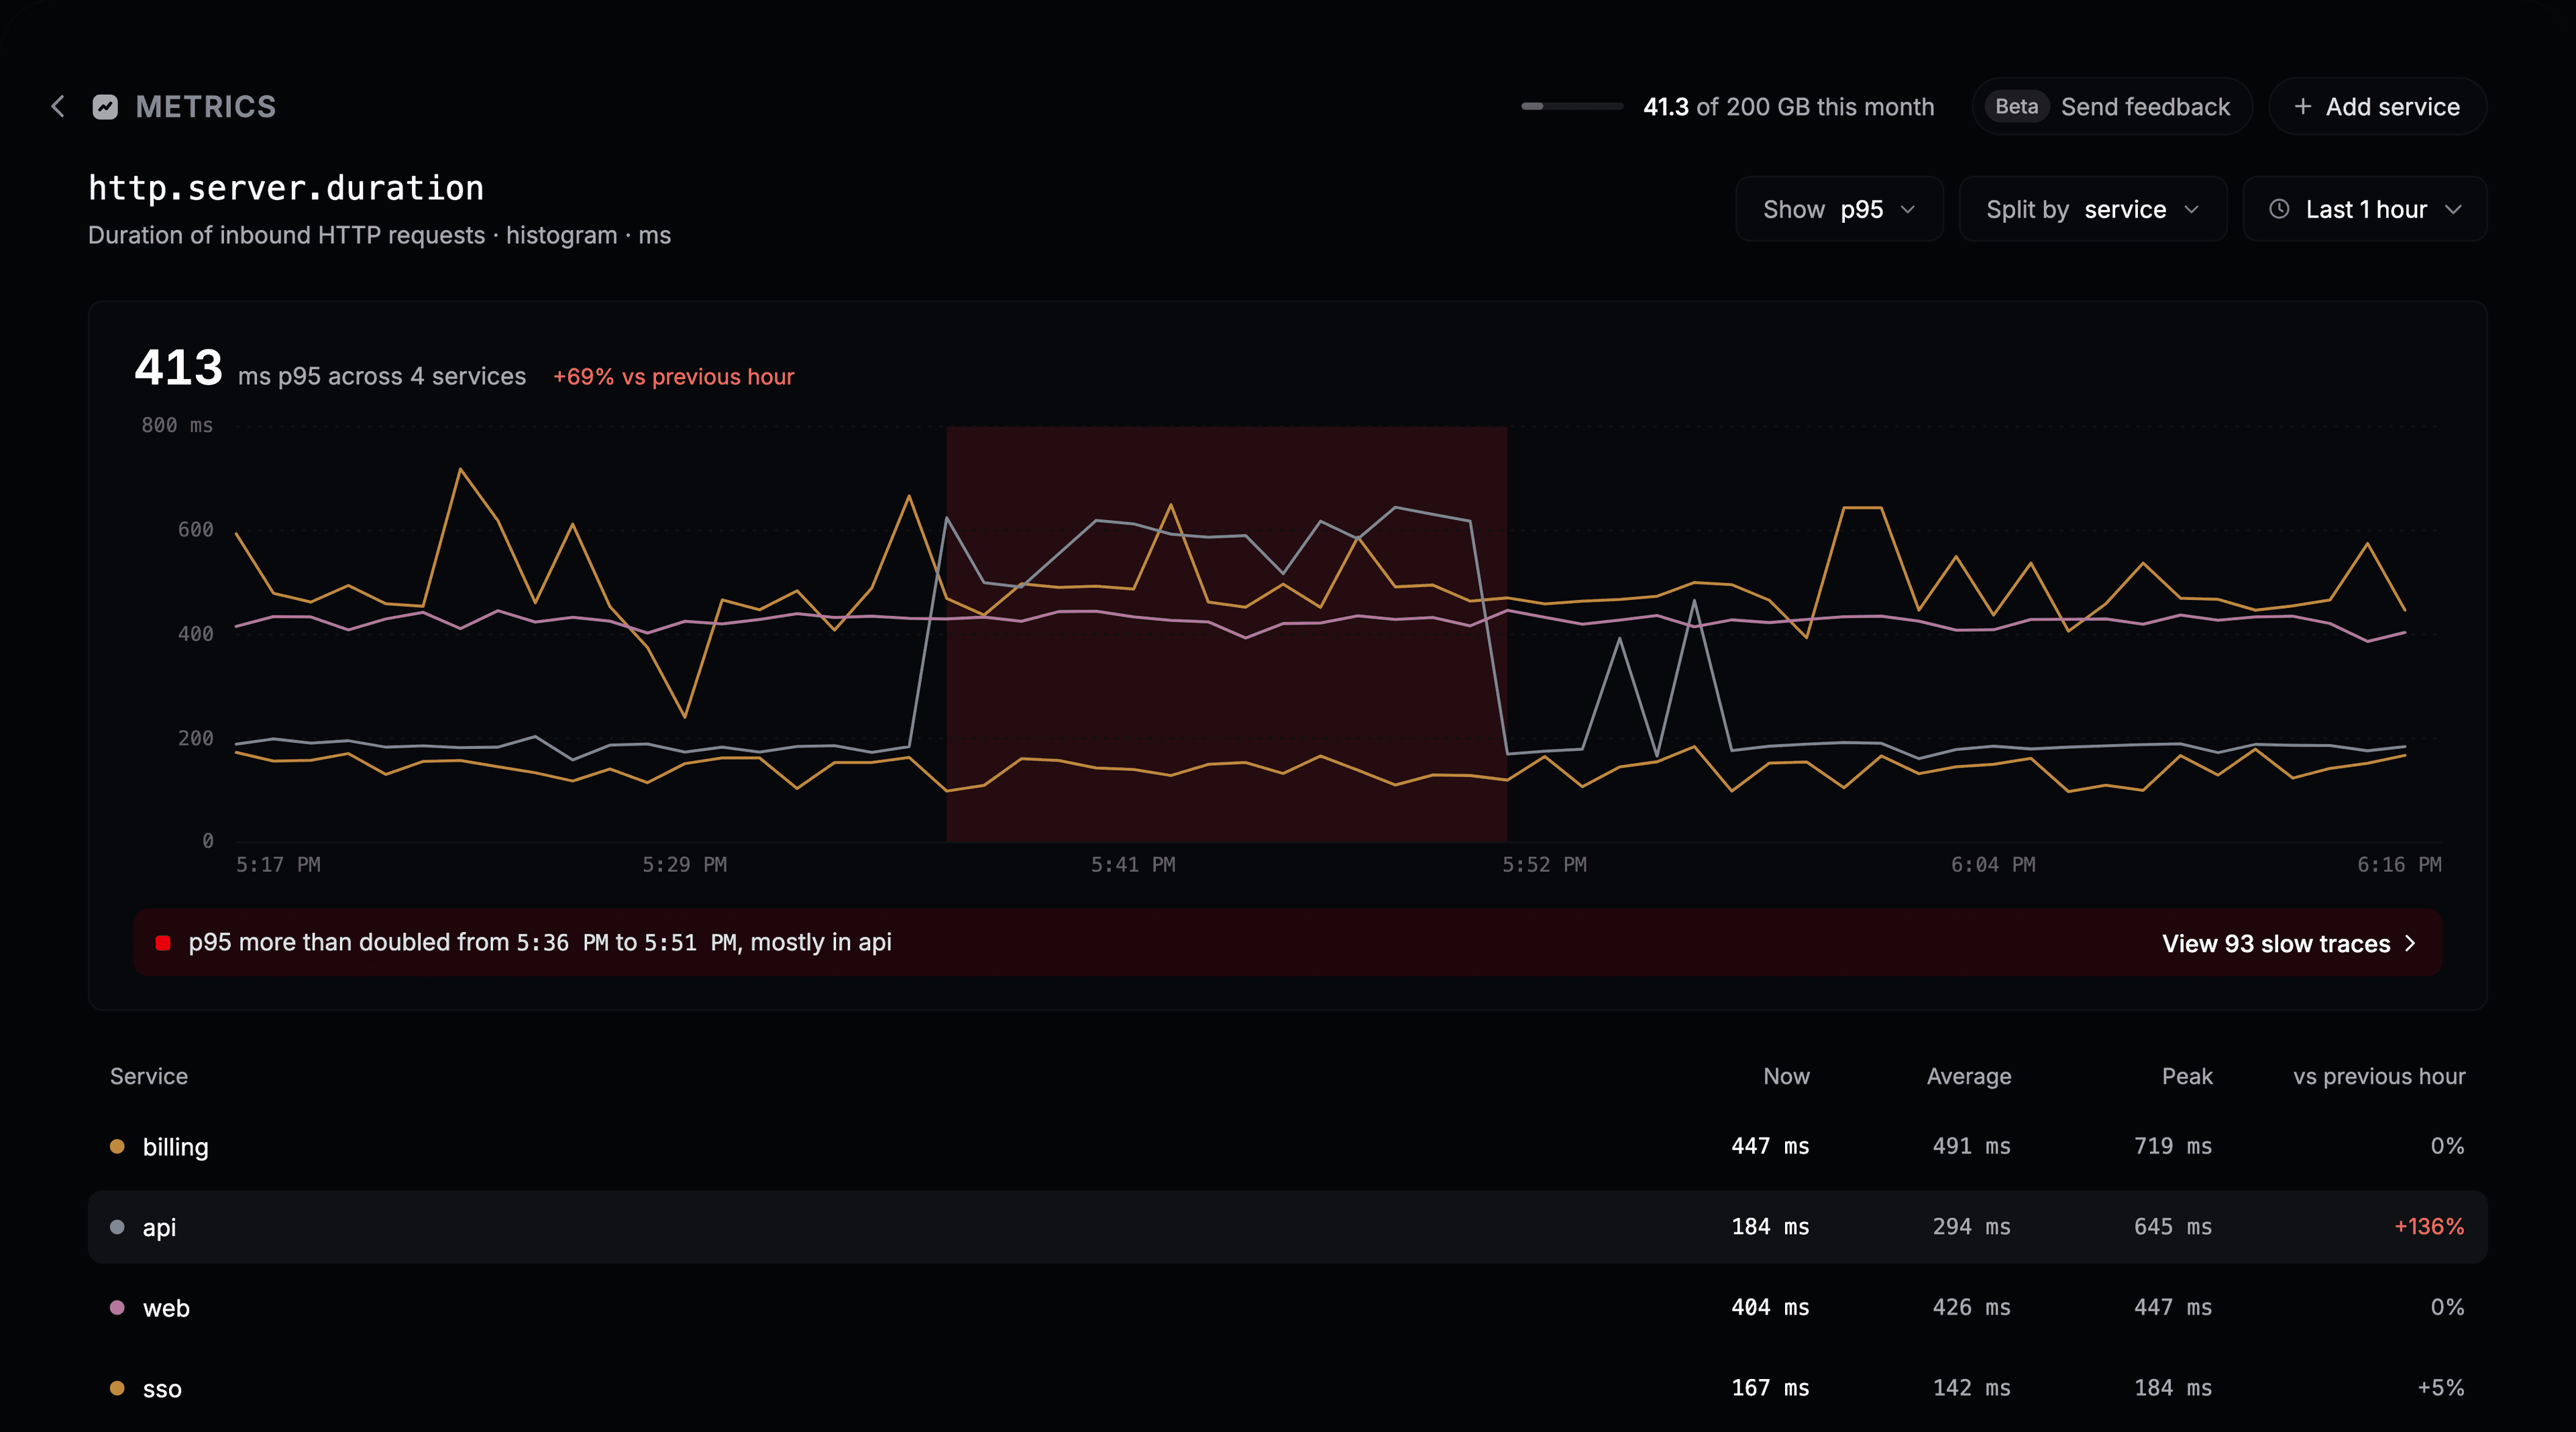
- Show picks how values are combined. Durations offer
p50,p90,p95,p99, average and max. Gauges such as memory offer average, min and max. Counters offer rate per second and sum. - Split by draws one line per service, or a single line for none.
- Point at a service in the table to highlight its line. Click it to keep it highlighted.
Follow a spike
When a metric more than doubles for a while, Instatus highlights the window on the chart and says which service caused most of it.
If the metric is a request duration, View N slow traces opens Traces on the slow requests from that window. Open one to see which step was slow.