⌘ K
LoginStart free
  • Get started
  • Monitoring
    • Website
    • API
    • Cron
    • Ping
    • TCP & UDP
    • DNS
    • Alerts
    • Mobile app
  • Incident response
    • Incidents
    • Maintenance
    • Templates
    • General notices
    • On-call
    • Escalation policies
    • Routing rules
    • Slack
  • Status page
    • Public page
    • Private page
    • Select audience
    • Components
    • Third party components
    • Notices
    • Customize
    • Multi-language
    • Widgets
    • Custom domain
    • Subscribers
    • Metrics
    • Notifications
      • Email
      • SMS
      • Webhook
      • X
      • Slack
      • Microsoft Teams
      • Discord
      • Google Chat
      • RSS & Atom
      • API
  • Team
    • Upgrade
    • Single Sign-On
    • Activity Log
    • Delete account
  • Integrations
    • Webhook
    • Email
    • Better Uptime
    • Checkly
    • Datadog
    • Freshping
    • Grafana
    • HetrixTools
    • Jira
    • Zendesk
    • New Relic
    • PagerDuty
    • Pingdom
    • Prometheus
    • Runscope
    • Site24x7
    • StatusCake
    • Uptime Robot
    • Updown.io
    • Dynatrace
    • Google Cloud Monitoring
    • Metrics
      • Datadog
      • Pingdom
      • New Relic
      • Prometheus
  • API
    • Monitors
    • Incidents
    • Incident updates
    • Status pages
    • Workspaces
    • Components
    • Teammates
    • Maintenances
    • Maintenance updates
    • Templates
    • General notices
    • Subscribers
    • Metrics
    • User profile
    • Outages
    • Public data
    • Private pages
    • Monitoring integrations
    • Audience Groups
    • Routing Rules
    • Escalation Policies
    • On-call Schedules

Import your Datadog checks

You can import your datadog checks directly to be displayed as metrics on your status page.

  1. To do this, head to Status page → Metrics → Datadog.

  2. You'll need your Datadog API key and Datadog Application key.

Datadog API key and Application key input
  1. After entering it and clicking Save you'll be able to see your Datadog checks.
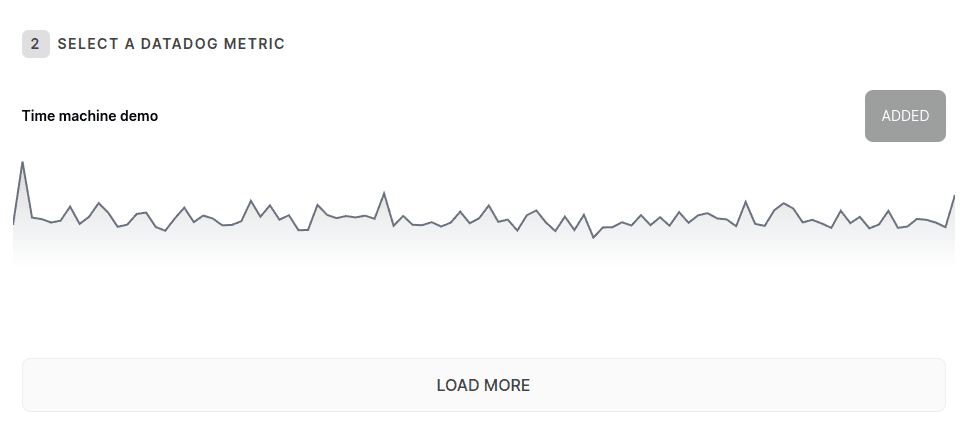
Datadog checks selection
  1. You can now select the checks you want to display on your status page.
  2. Go to your status page and you can find your metric displayed.
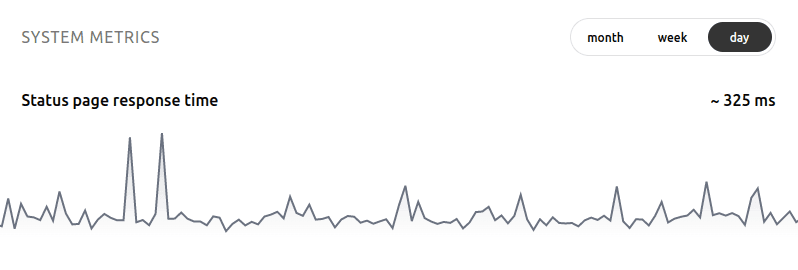
Metric displayed on status page

Quick Help

Learn More

Help & API
Pricing

Updates

Changelog
Blog

Follow Us

All systems operational

© Instatus, Inc
Policies