Logs
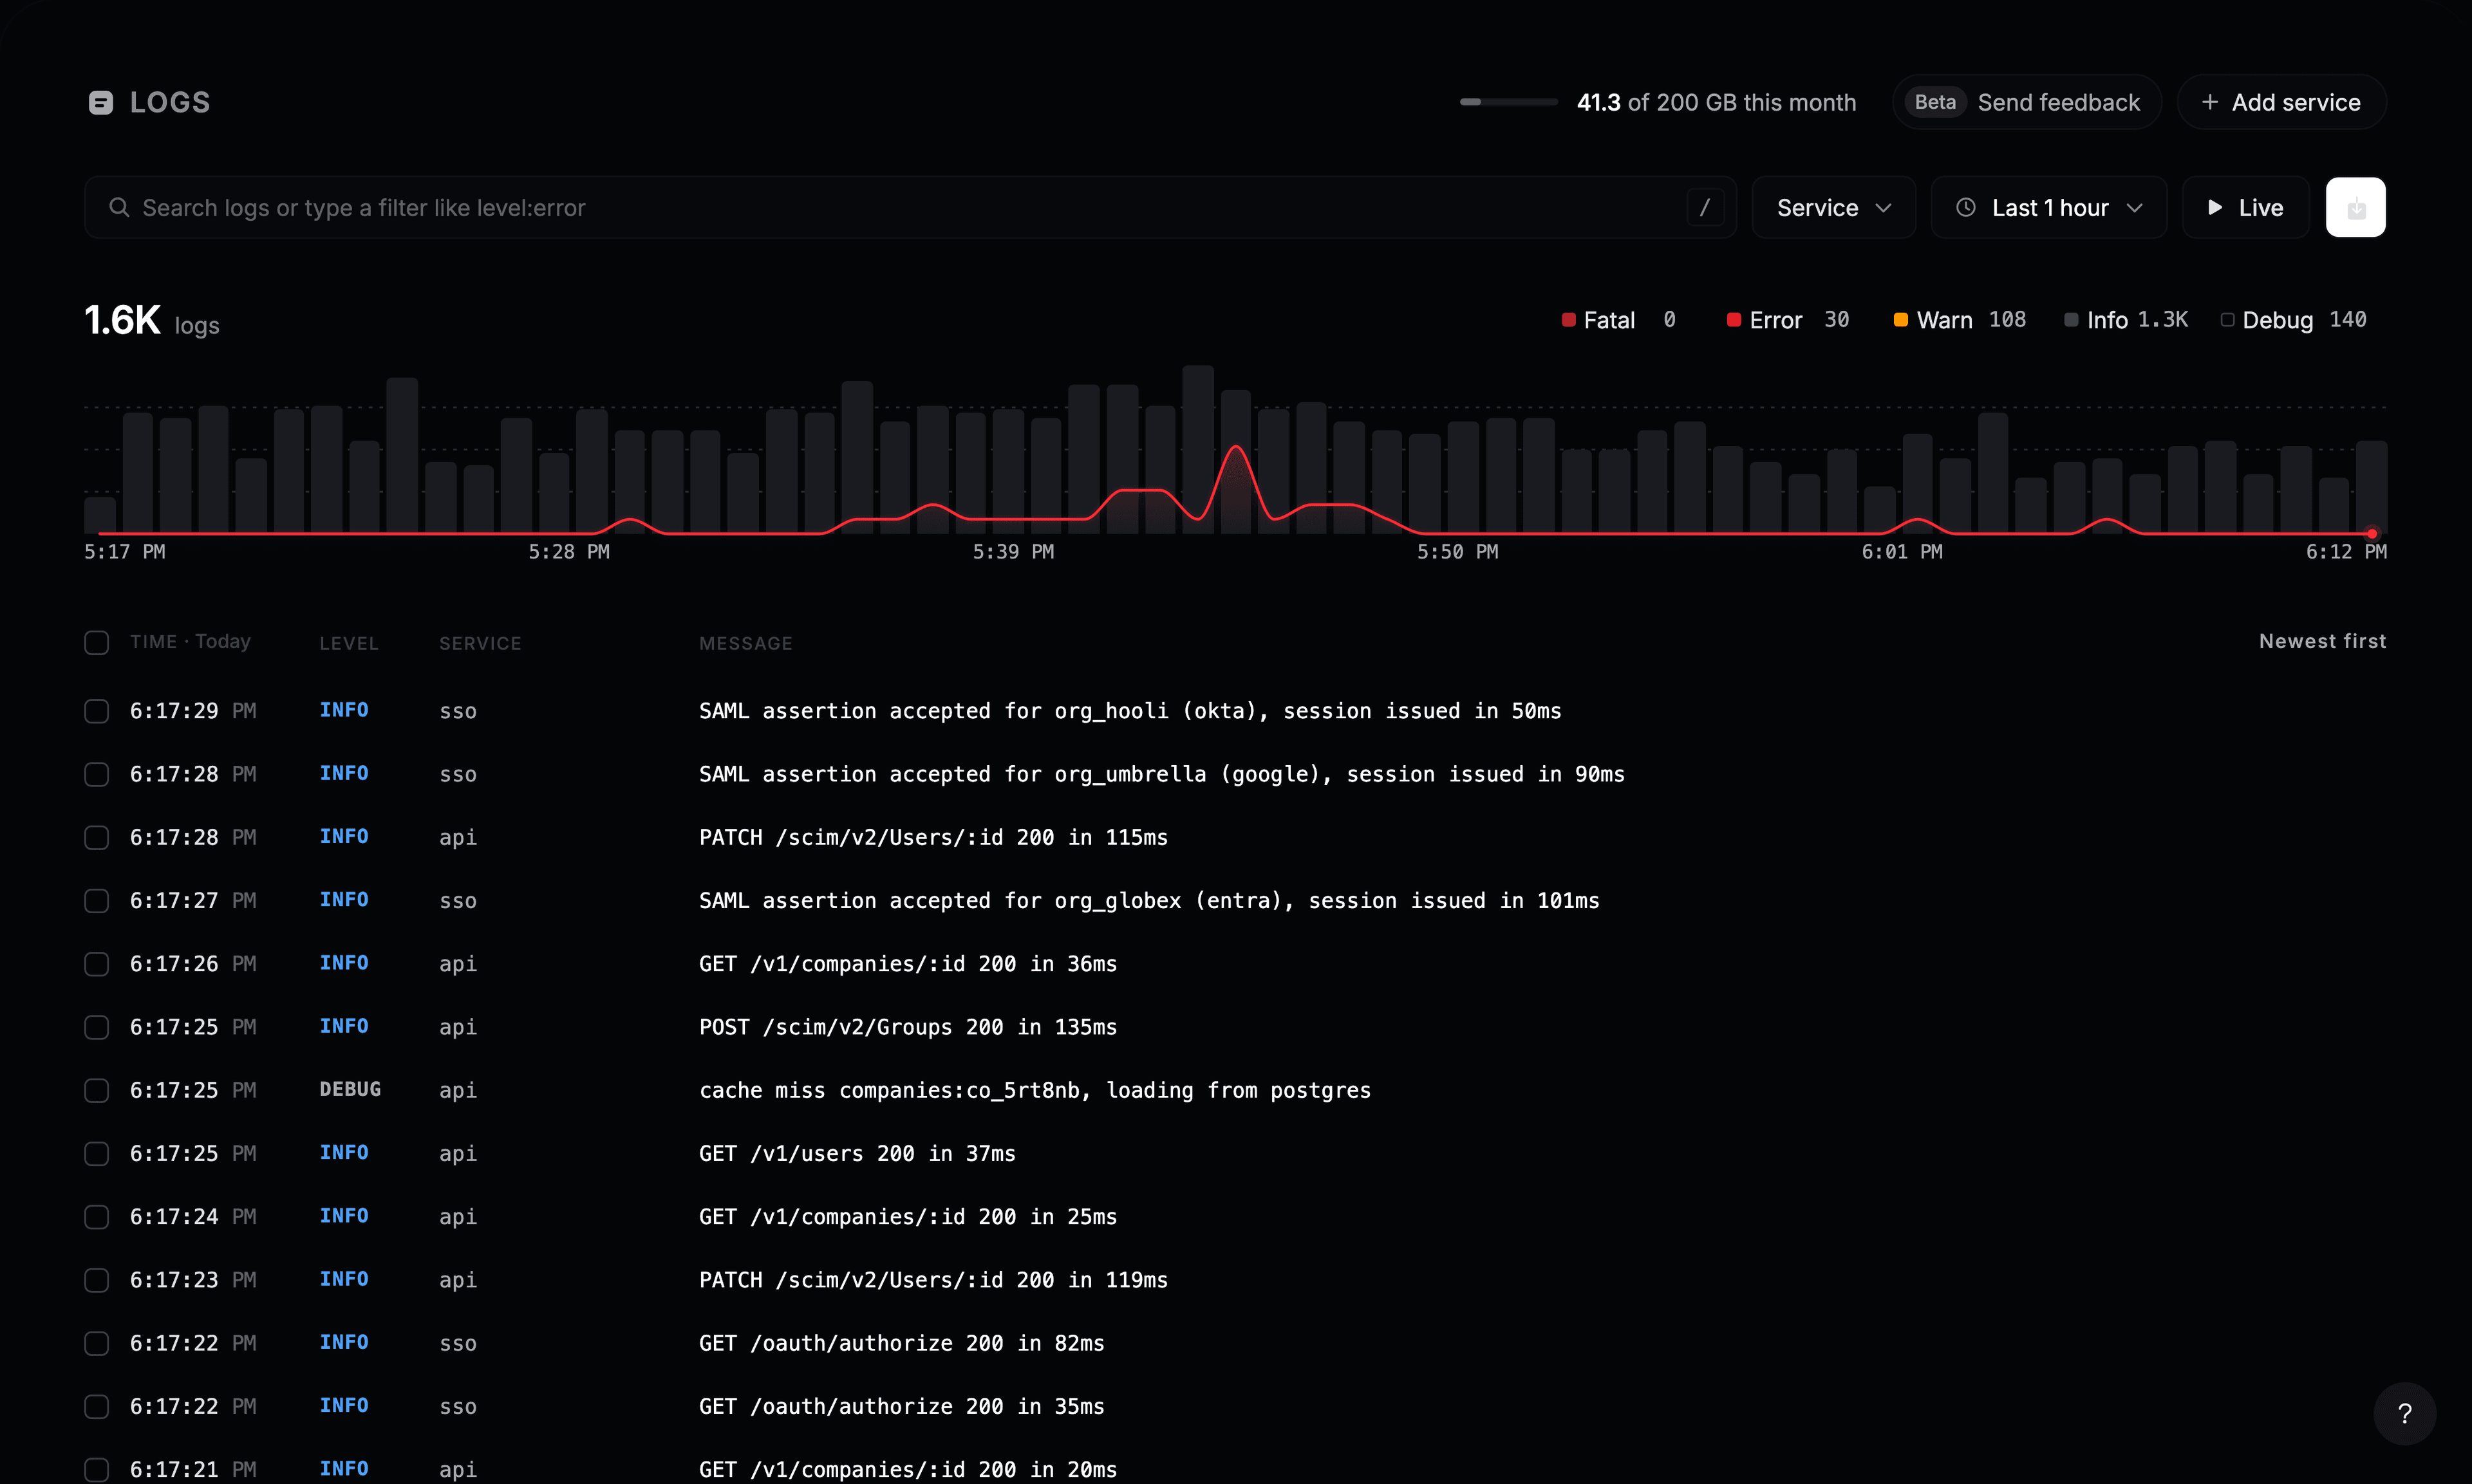
Open Observability → Logs on your status page. The newest logs are at the top, with a chart of log volume above them. The red line in the chart is errors, so you can see when something started at a glance.
Search
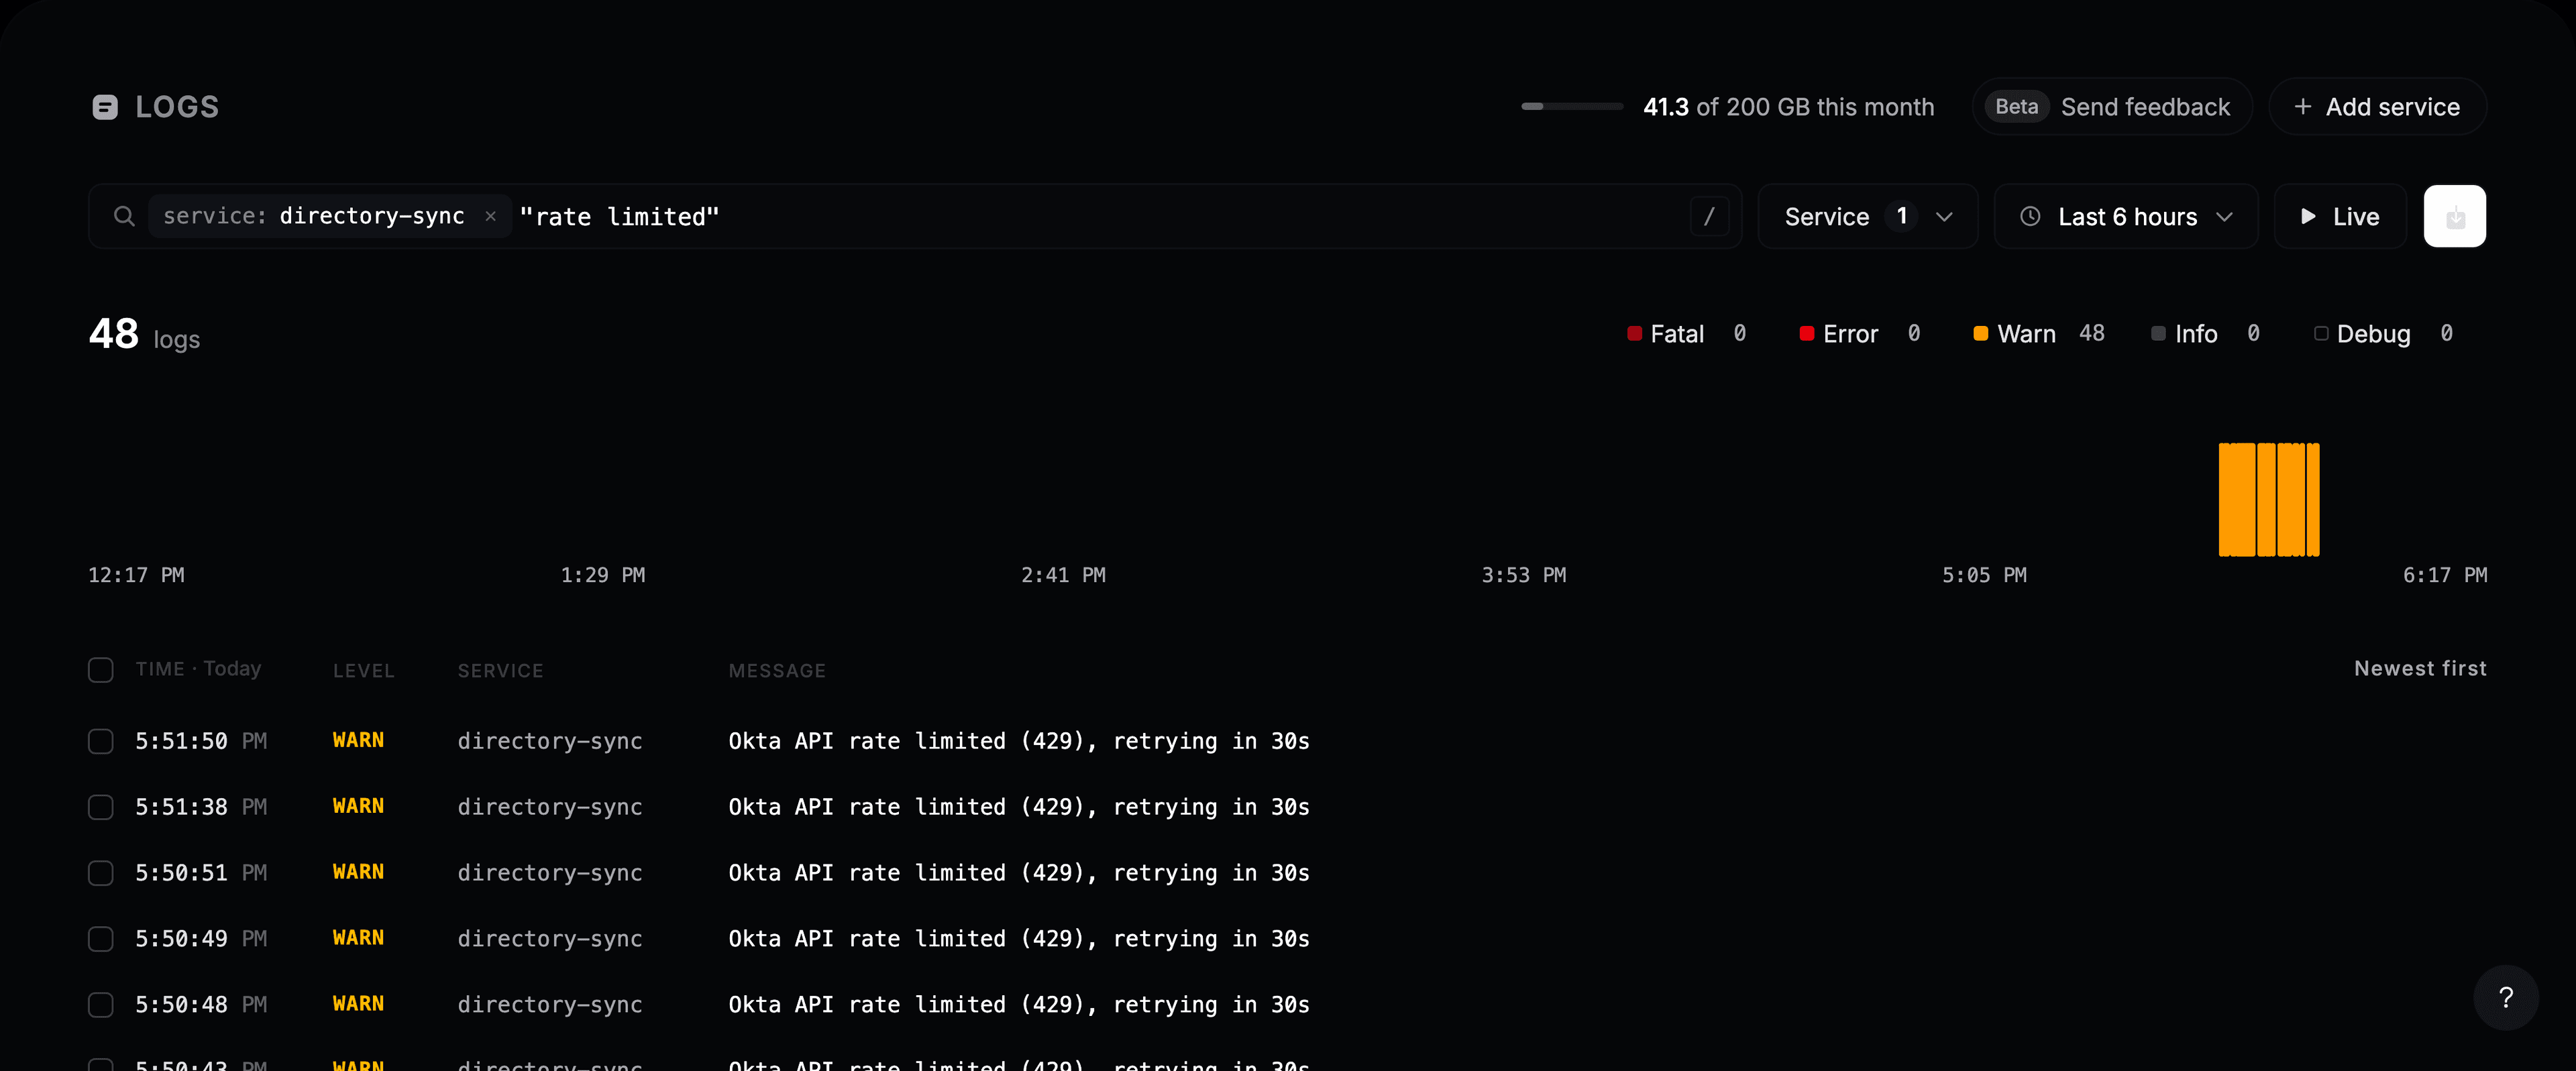
Type words in the search box and press Enter. Words match anywhere in the message, in any order. Put a phrase in quotes to match it exactly, such as "rate limited".
The chart, the counts and the list all update with your search.
Filter
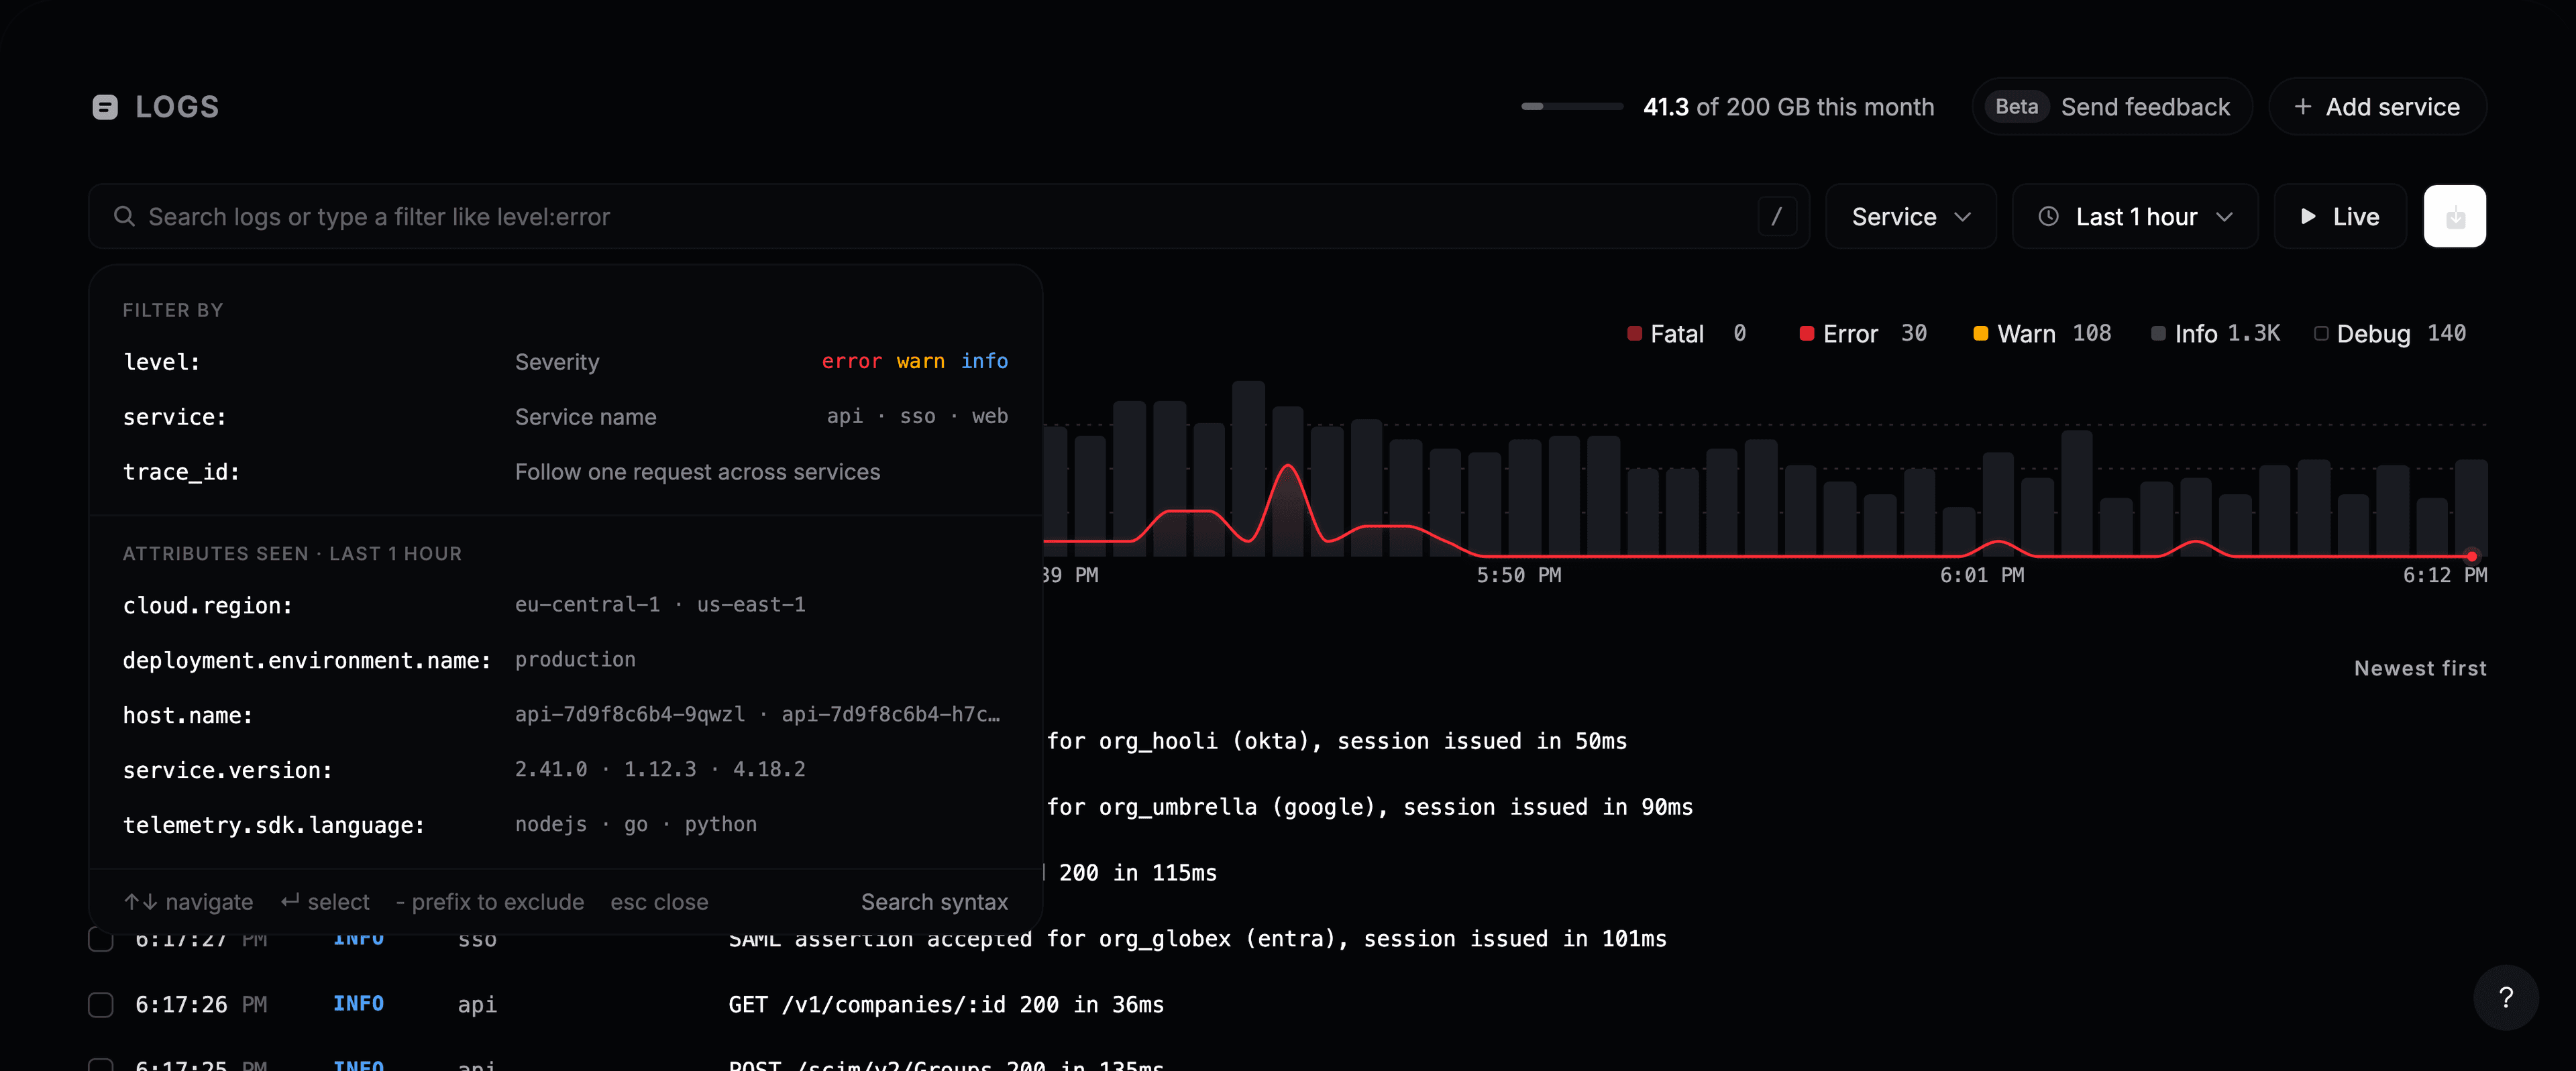
Click the empty search box to see what you can filter on. Pick a field, then a value. Each field lists its most common values, with how often they appear.
| Filter | Finds |
|---|---|
level: | A level: fatal, error, warn, info, debug or trace |
service: | Logs from one service |
trace_id: | Every log from one request, across all services |
| Any attribute | Type its name, such as http.route: or customer.id: |
A filter becomes a chip in the search box. Click its × to remove it. Put - in front of a filter to exclude it, such as -level:debug.
Filter by level
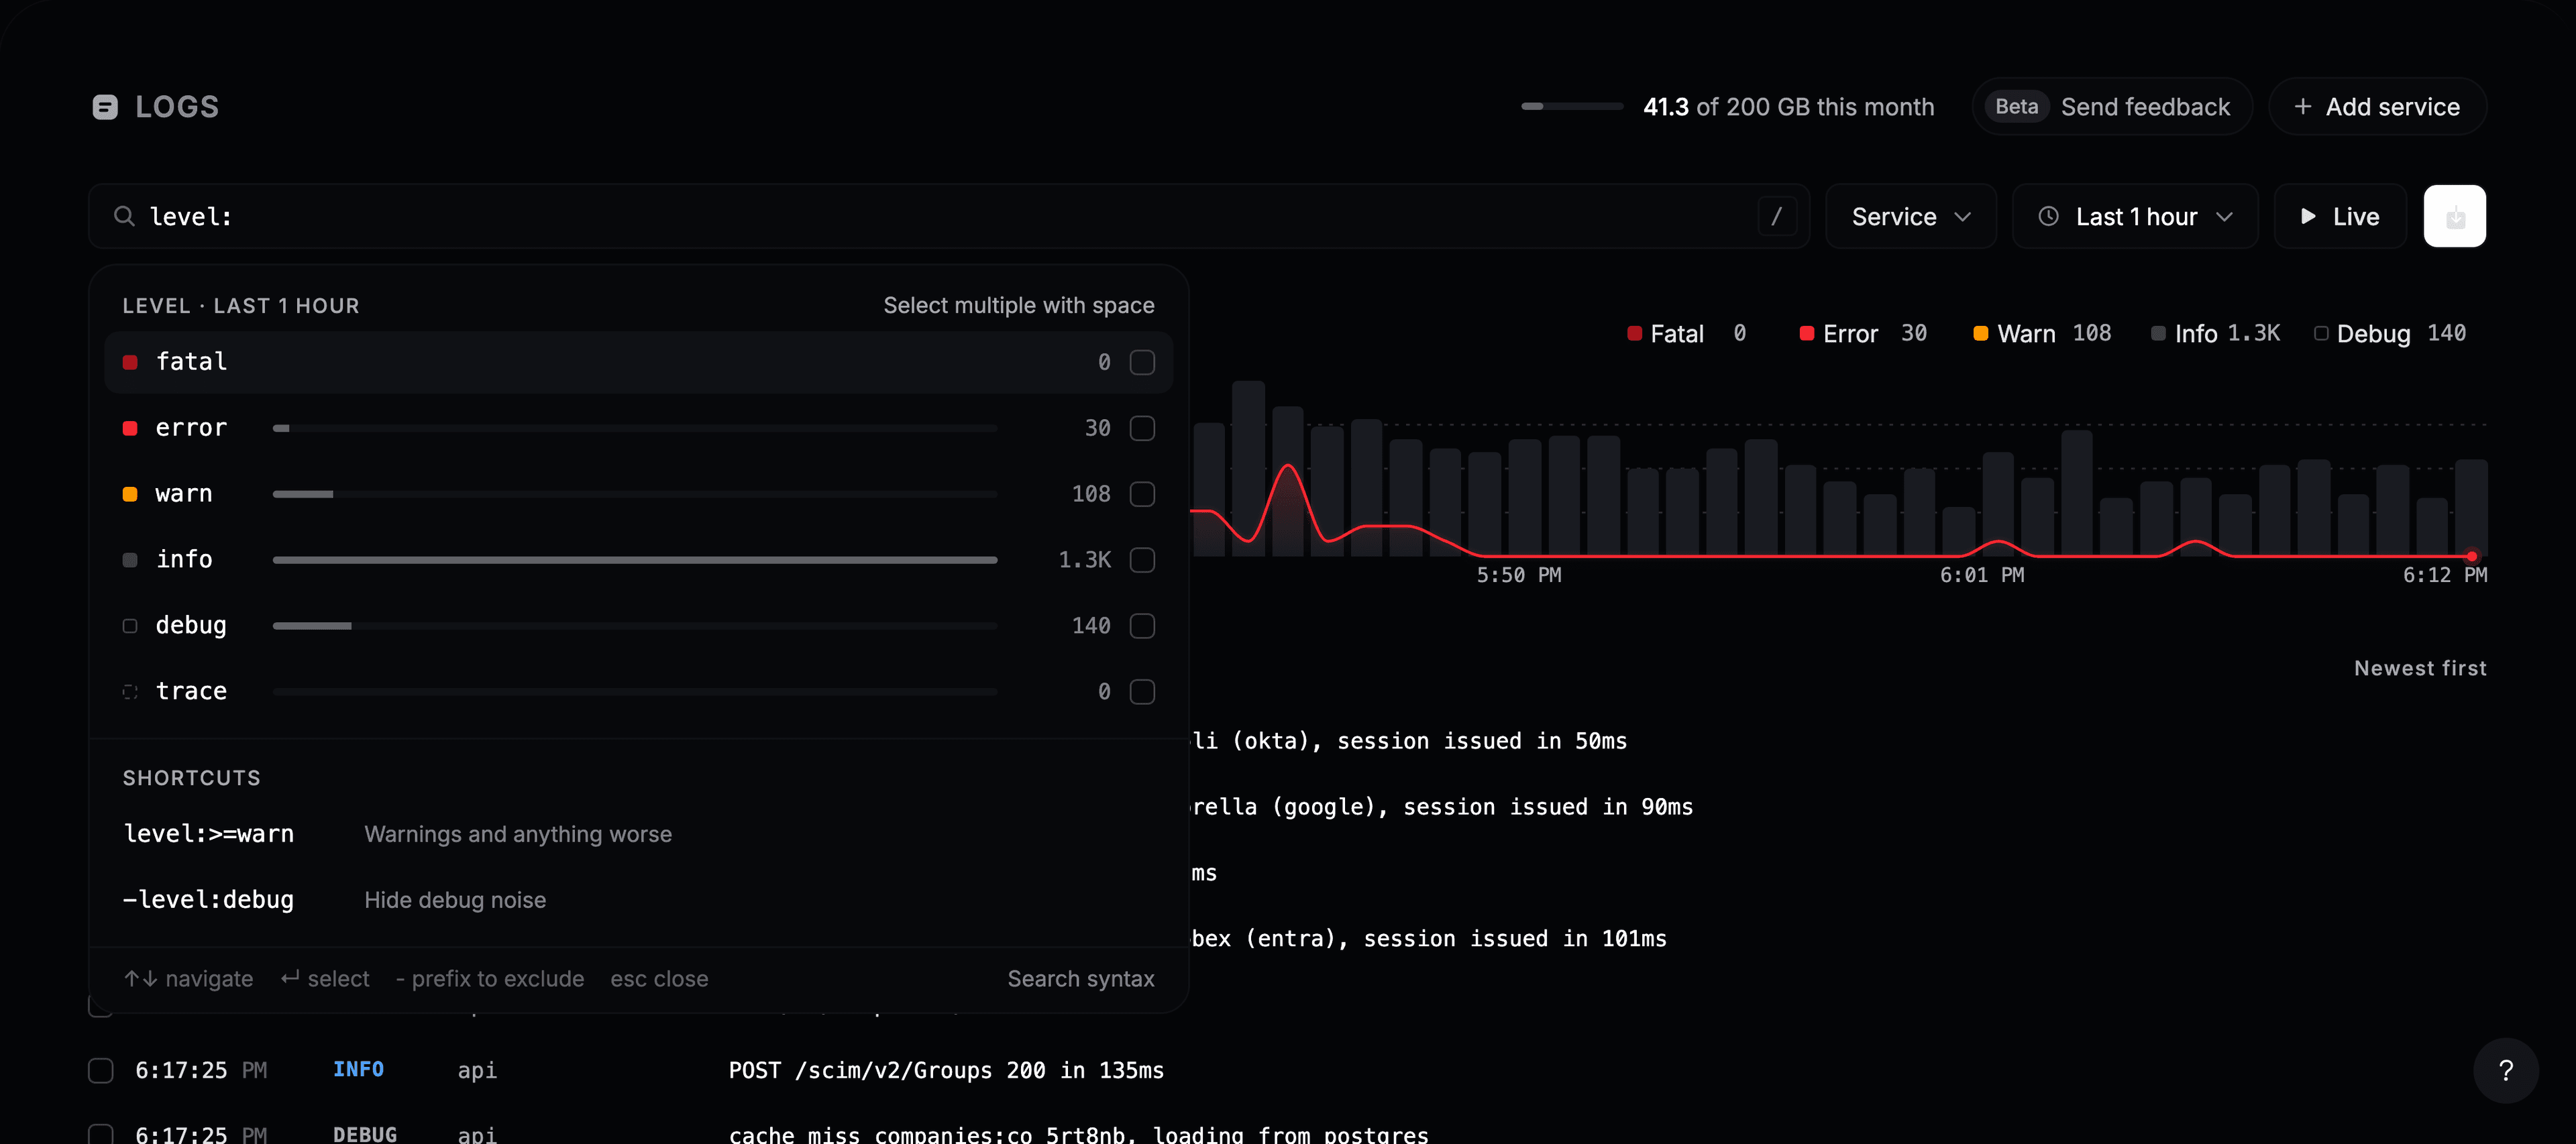
Type level: to open the level picker. It shows how many logs each level has. Press Space to pick several, then Enter. Two shortcuts cover the usual cases: level:>=warn keeps warnings and anything worse, and -level:debug hides debug noise.
The Service button next to the search box is a shortcut for service:. Clicking a level above the chart turns that level on or off.
Search syntax
| Write | Finds |
|---|---|
timeout | Logs that contain the word |
"connection pool" | That exact phrase |
timeout retry | Both words, in any order |
timeout OR refused | Either word |
-timeout or NOT timeout | Logs without the word |
level:error service:api | Both filters |
(timeout OR refused) AND service:api | Grouped with parentheses |
service:"billing worker" | A value with spaces, in quotes |
AND, OR and NOT are written in capitals. If a search can’t be read, for example because a quote is never closed, the explorer says so and keeps the previous results.
Your recent searches are listed when you open the search box, so a search you use often is one click away.
Change the time range
Click the time range button to pick the last 15 minutes up to the last 7 days, or set a custom range with From and To.
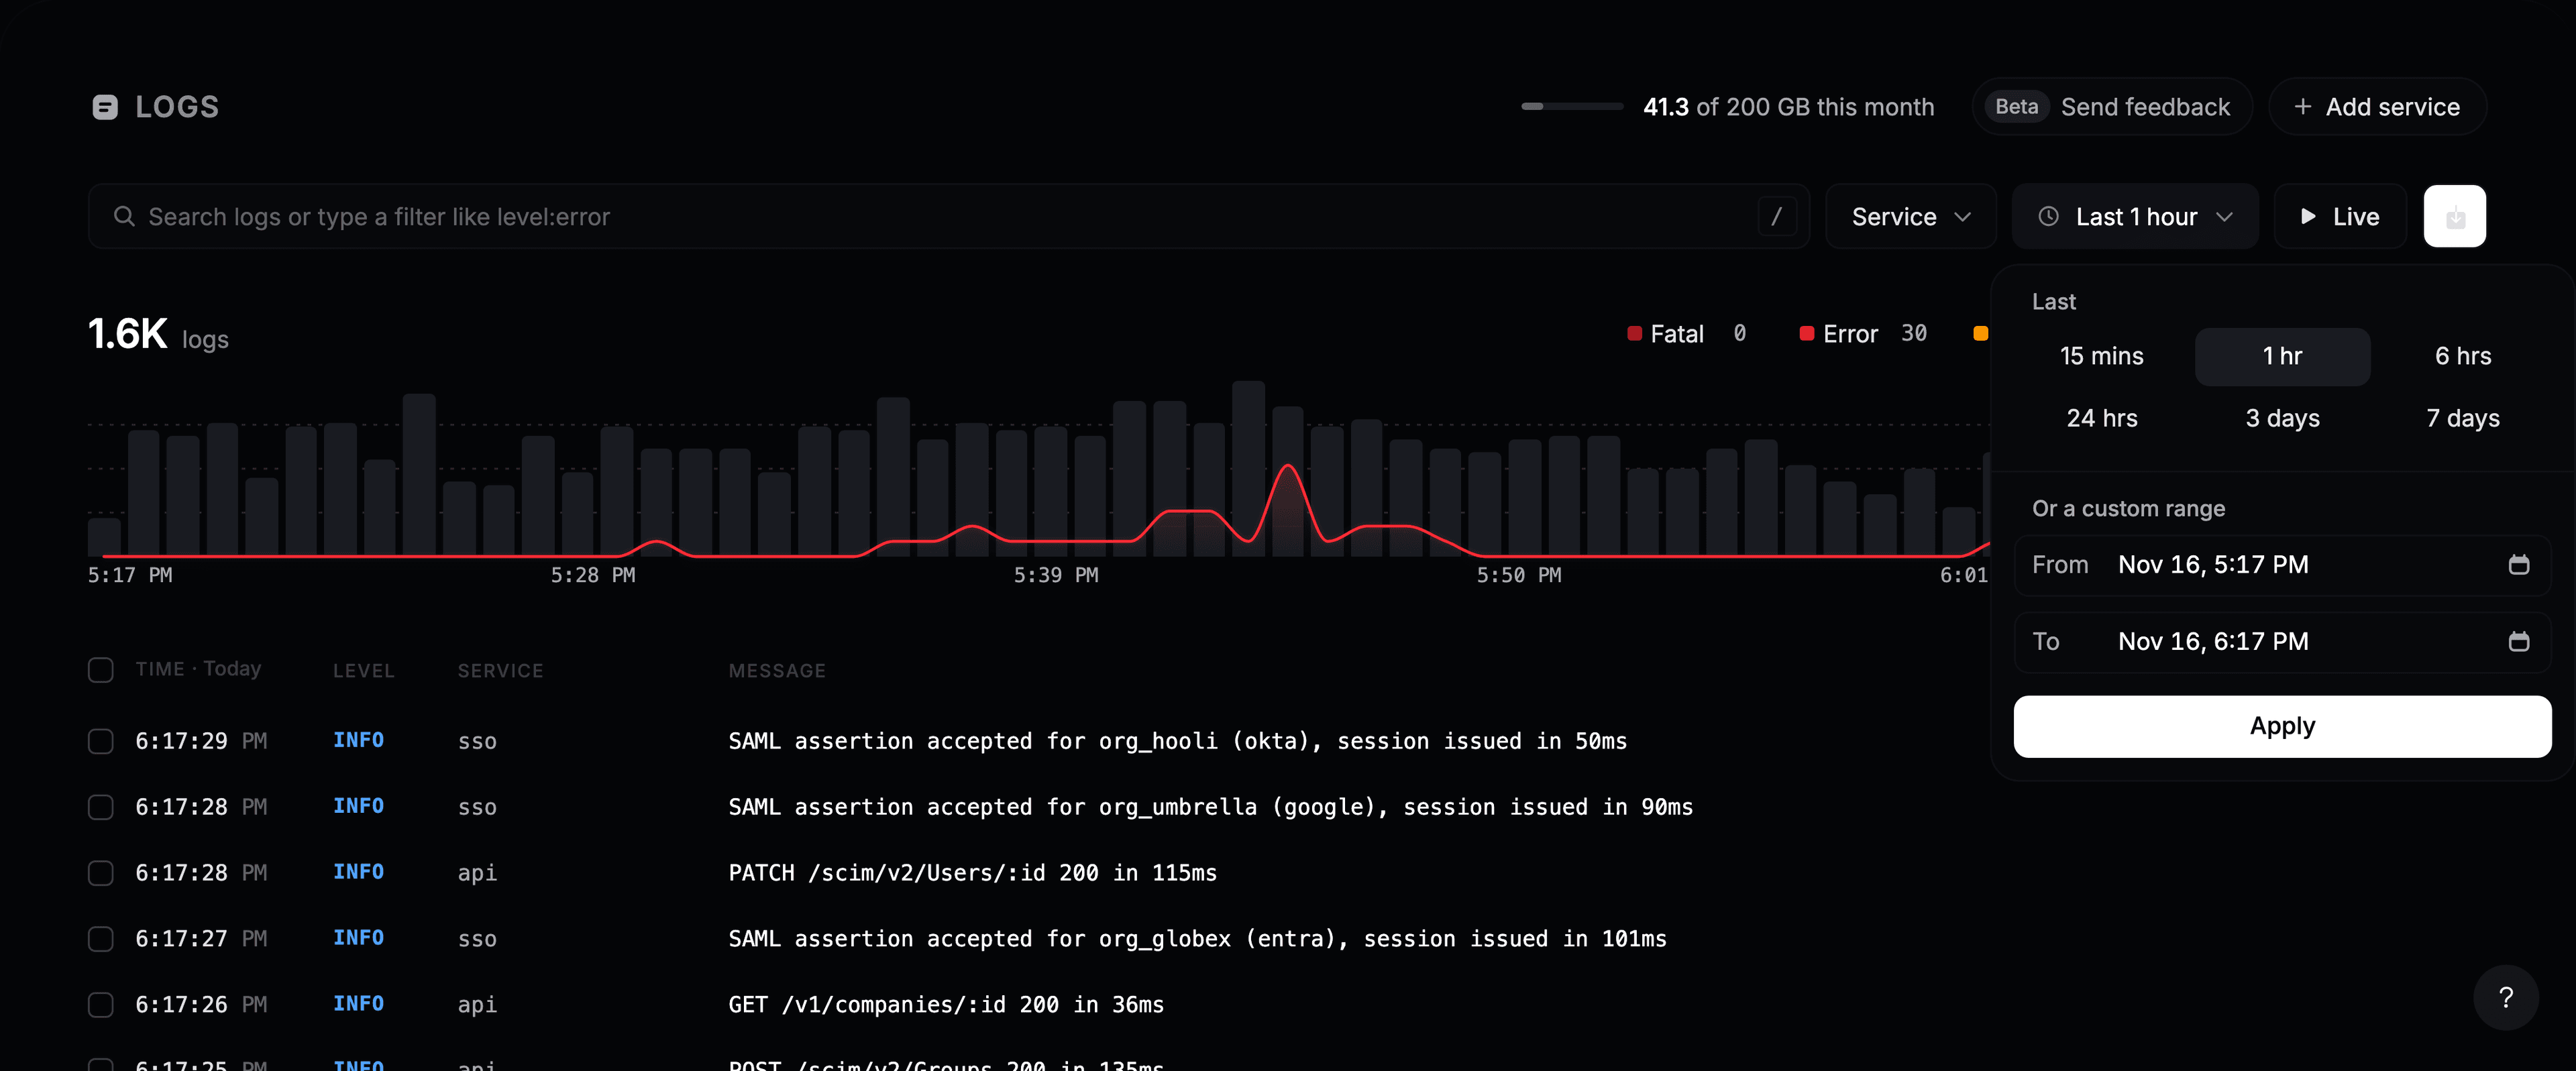
To zoom into a spike, drag across it on the chart. The back button returns to the range you had before.
Read a log
Click a row, or move to it with ↑ ↓ and press Enter. The detail pane opens with:
- The full message, with Copy message.
- Logs like this, to search for similar messages.
- N logs in this trace, when the log belongs to a request. It shows every log of that request, across services.
- The log’s attributes and its resource (the service, host and version it came from). Click a value to filter by it, exclude it or copy it.
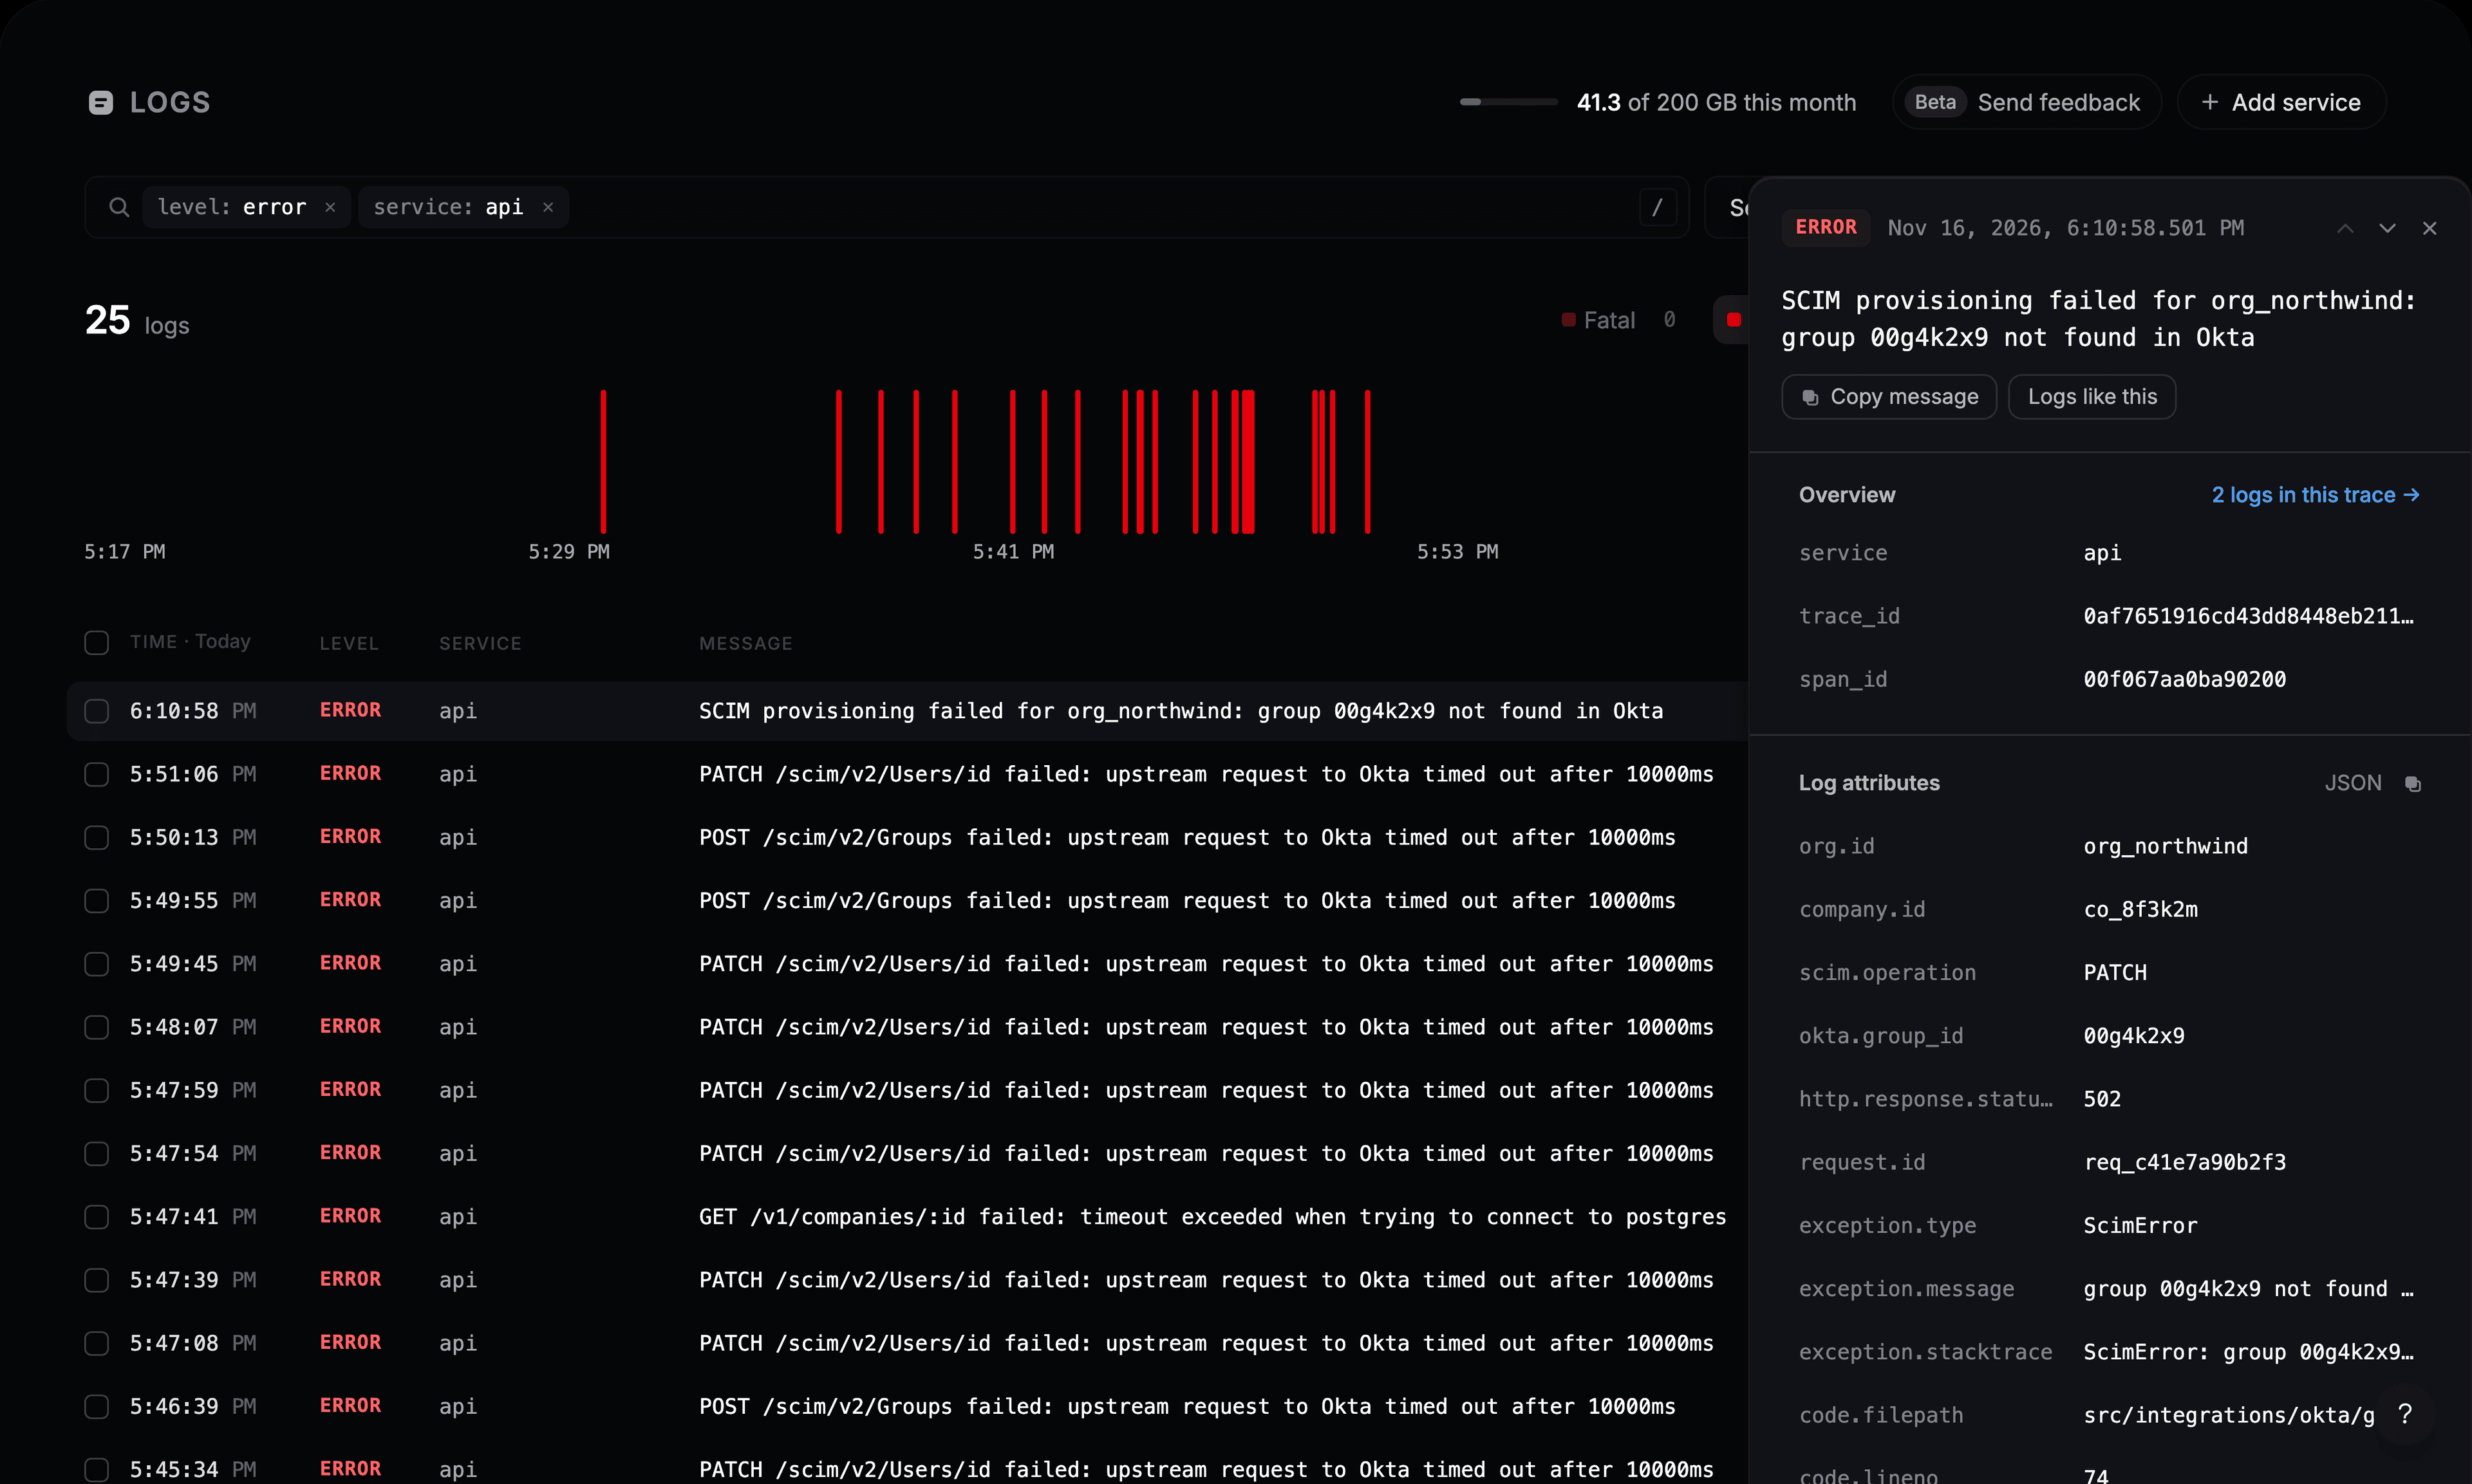
The arrows at the top of the pane move to the previous and next log.
Live tail
Press L, or click Live, to watch logs as they arrive. New logs appear at the top, and the header shows how many arrive per second. Your search and filters still apply, so level:error in live mode is a live error feed.
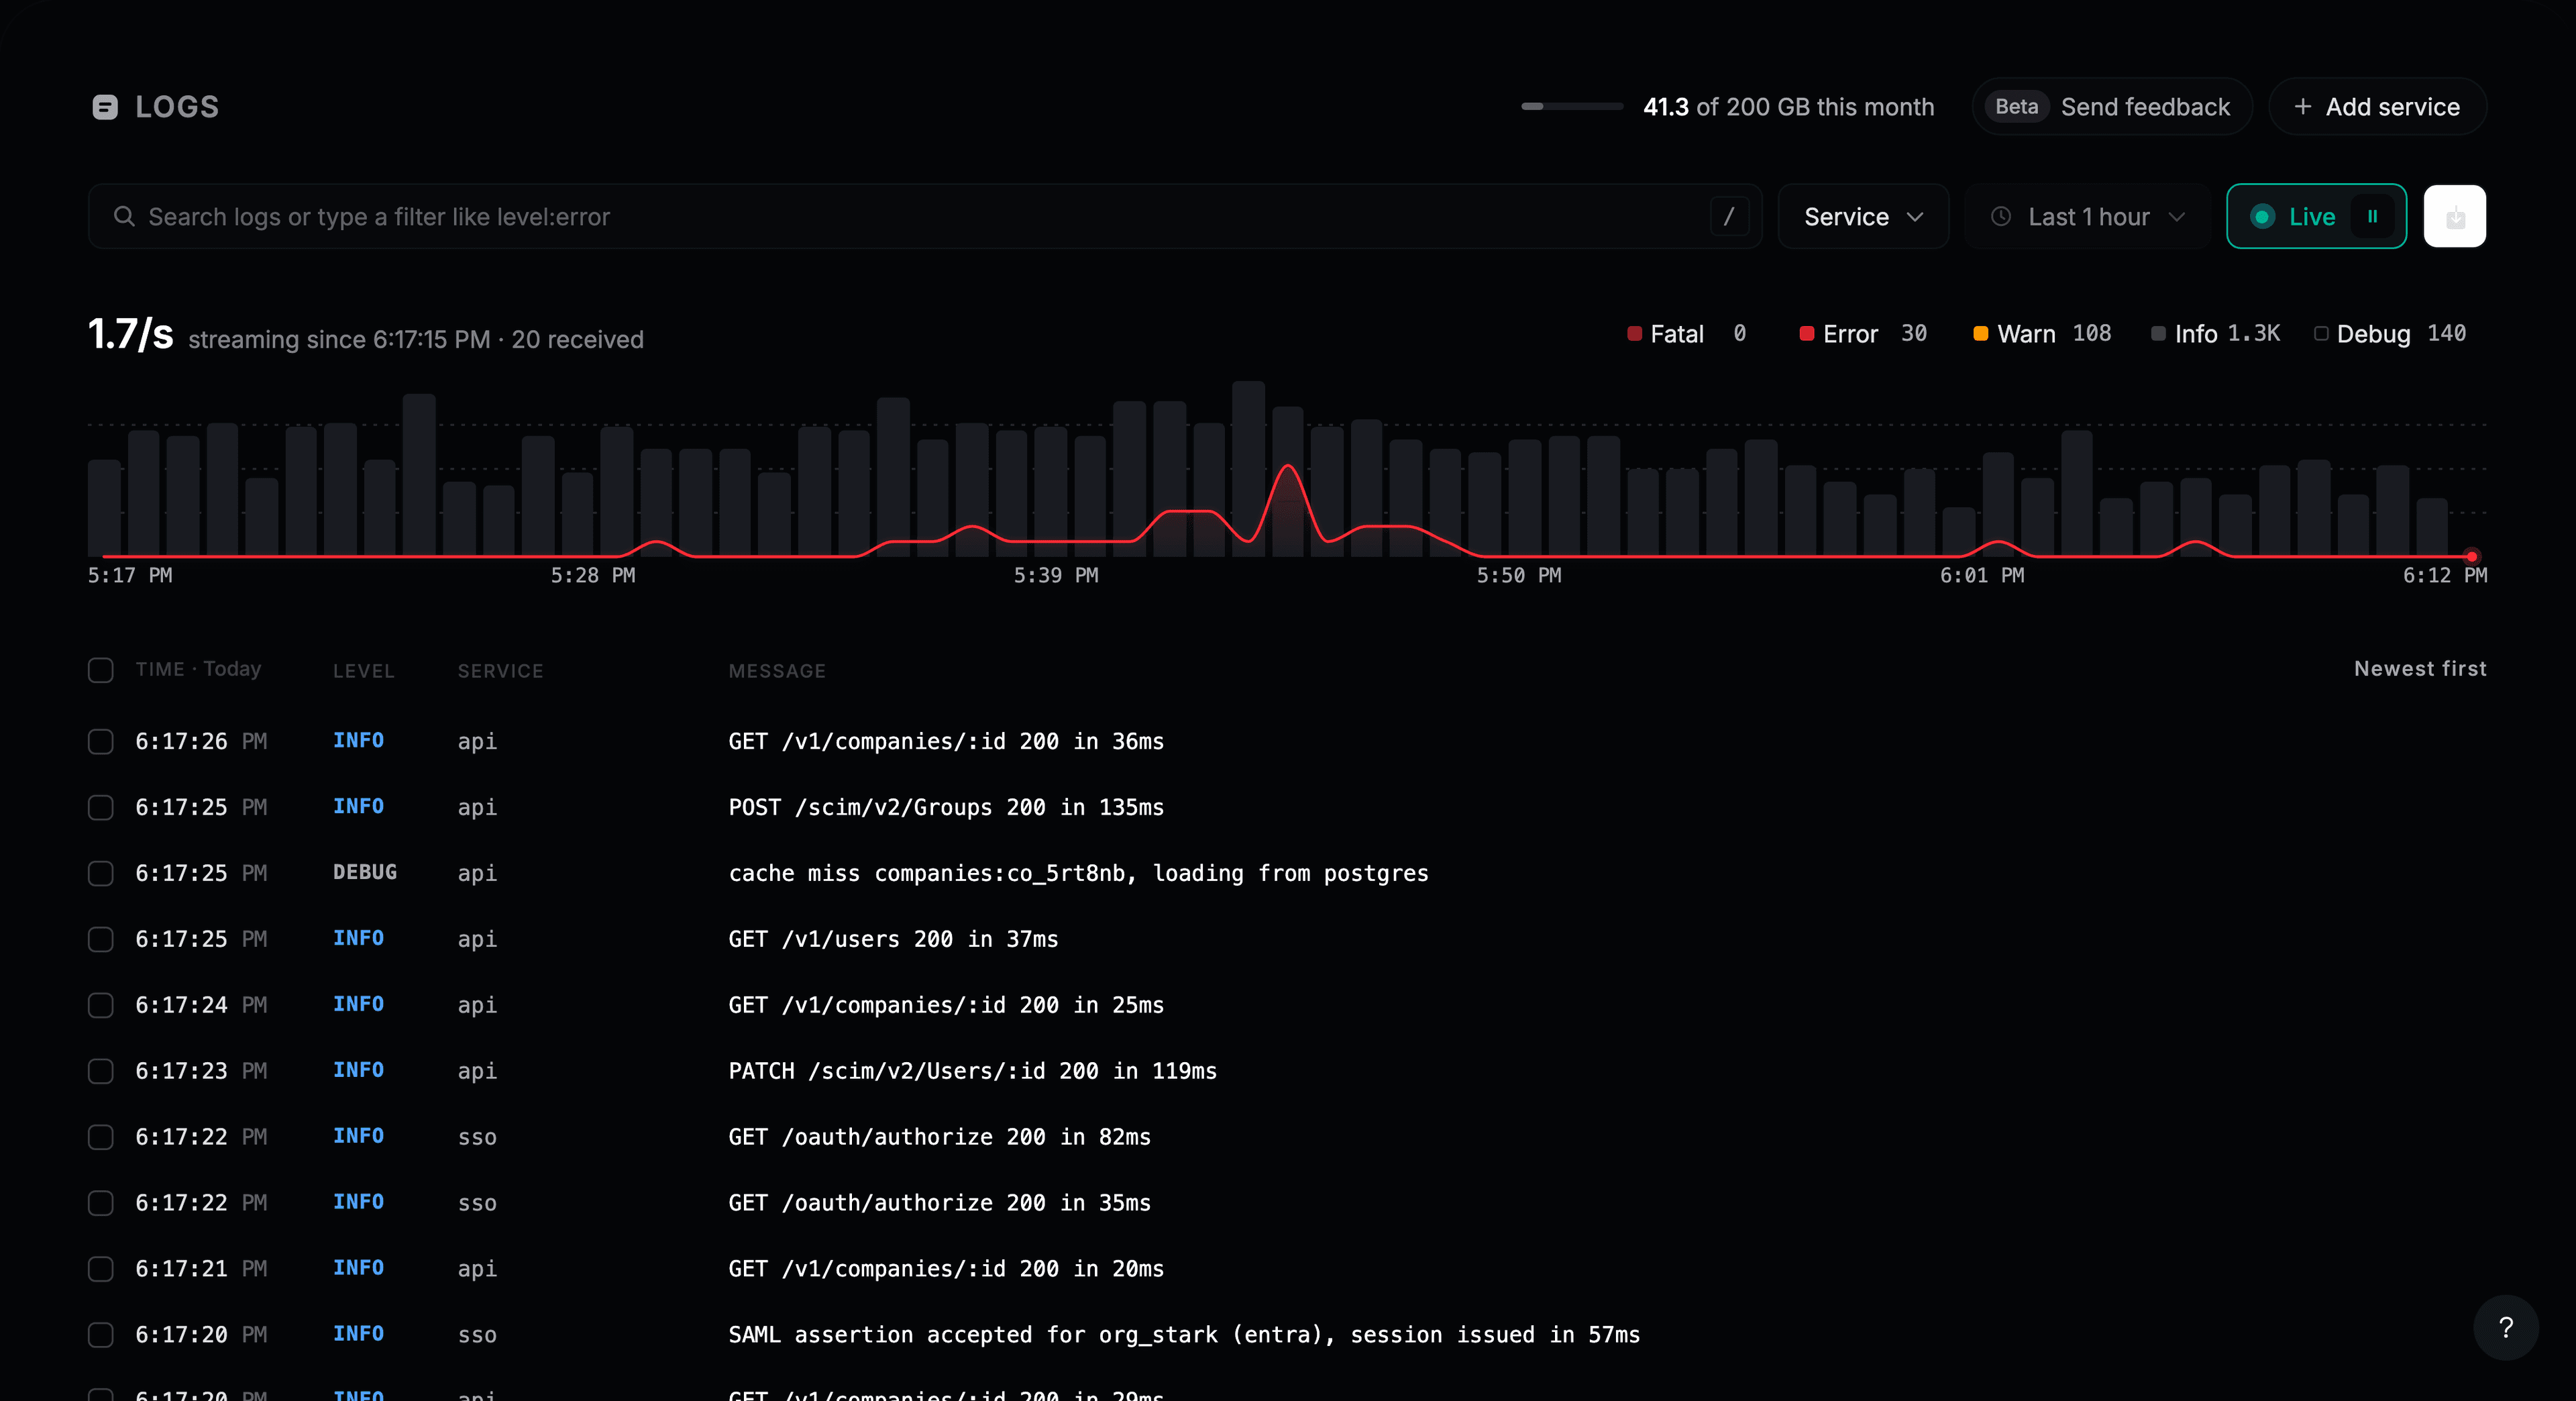
Click the pause button, or press L again, to stop. The chart keeps the time range you had before going live. If logs arrive faster than live tail can show, a notice says so: pause and search to see all of them.
Export
Tick the logs you want with the checkboxes. A bar appears above the list with Export CSV, Export JSON and Copy.
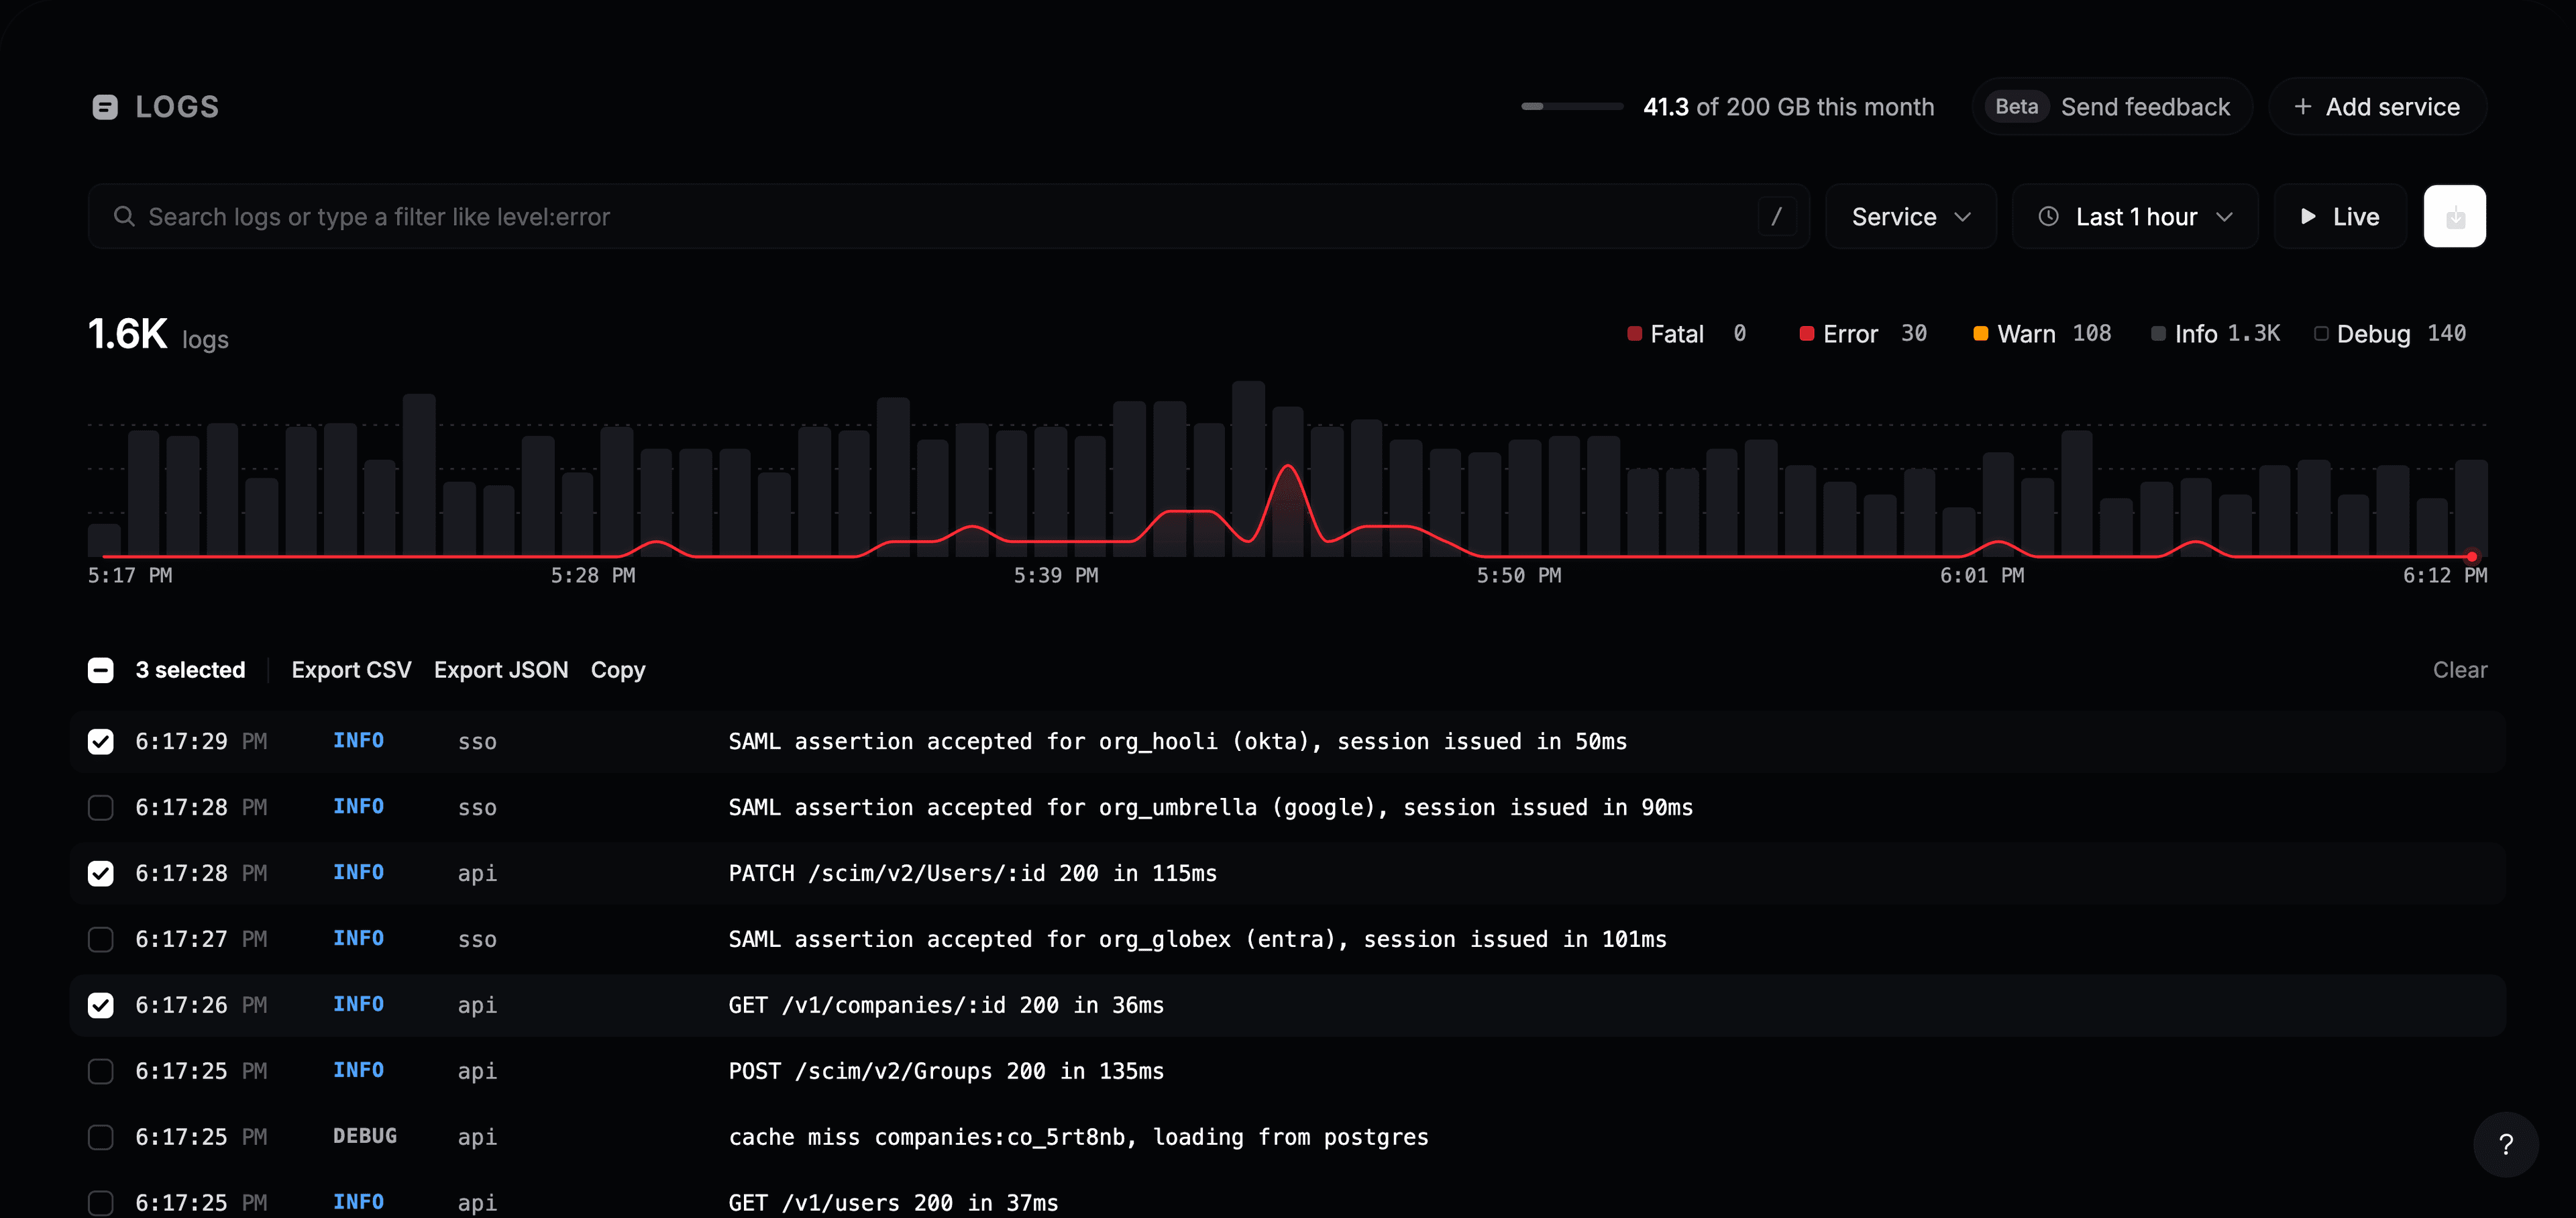
The download button at the end of the search bar exports every log loaded in the list as CSV. Exports contain the time, service, level and message of each log. To get a log’s attributes, open it and use Copy as JSON in the detail pane.
Keyboard shortcuts
| Key | Does |
|---|---|
↓ ↑ or J K | Move between logs |
Enter | Open the selected log |
Esc | Close the detail pane or a menu |
L | Start or stop live tail |
Space | Pick several values in a picker |