TCP & UDP Monitoring
TCP and UDP monitors allow you to verify that your servers and applications are reachable over specific network ports.
They're ideal for monitoring databases, mail servers, application backends, DNS servers, game servers, VoIP gateways, or any service that listens on a TCP or UDP port.
Just like with other monitors, if a TCP or UDP monitor detects a problem, your team can quickly investigate and resolve it and keep users informed via your status page.

What TCP Monitors Do
- Test whether a host and port are reachable from multiple global locations.
- Detect when a service goes offline, becomes slow to respond, or drops connections.
- Measure connection time and latency.
- Send alerts to your preferred communication channels when connectivity issues occur.
- Display uptime statistics on your status page.
What UDP Monitors Do
- Check if a target host and UDP port are reachable.
- Measure packet loss and response latency.
- Detect when a UDP-based service stops responding or becomes unstable.
- Track uptime and reliability across multiple global locations.
- Display performance metrics on your public or internal status page.
Setting Up a TCP Monitor
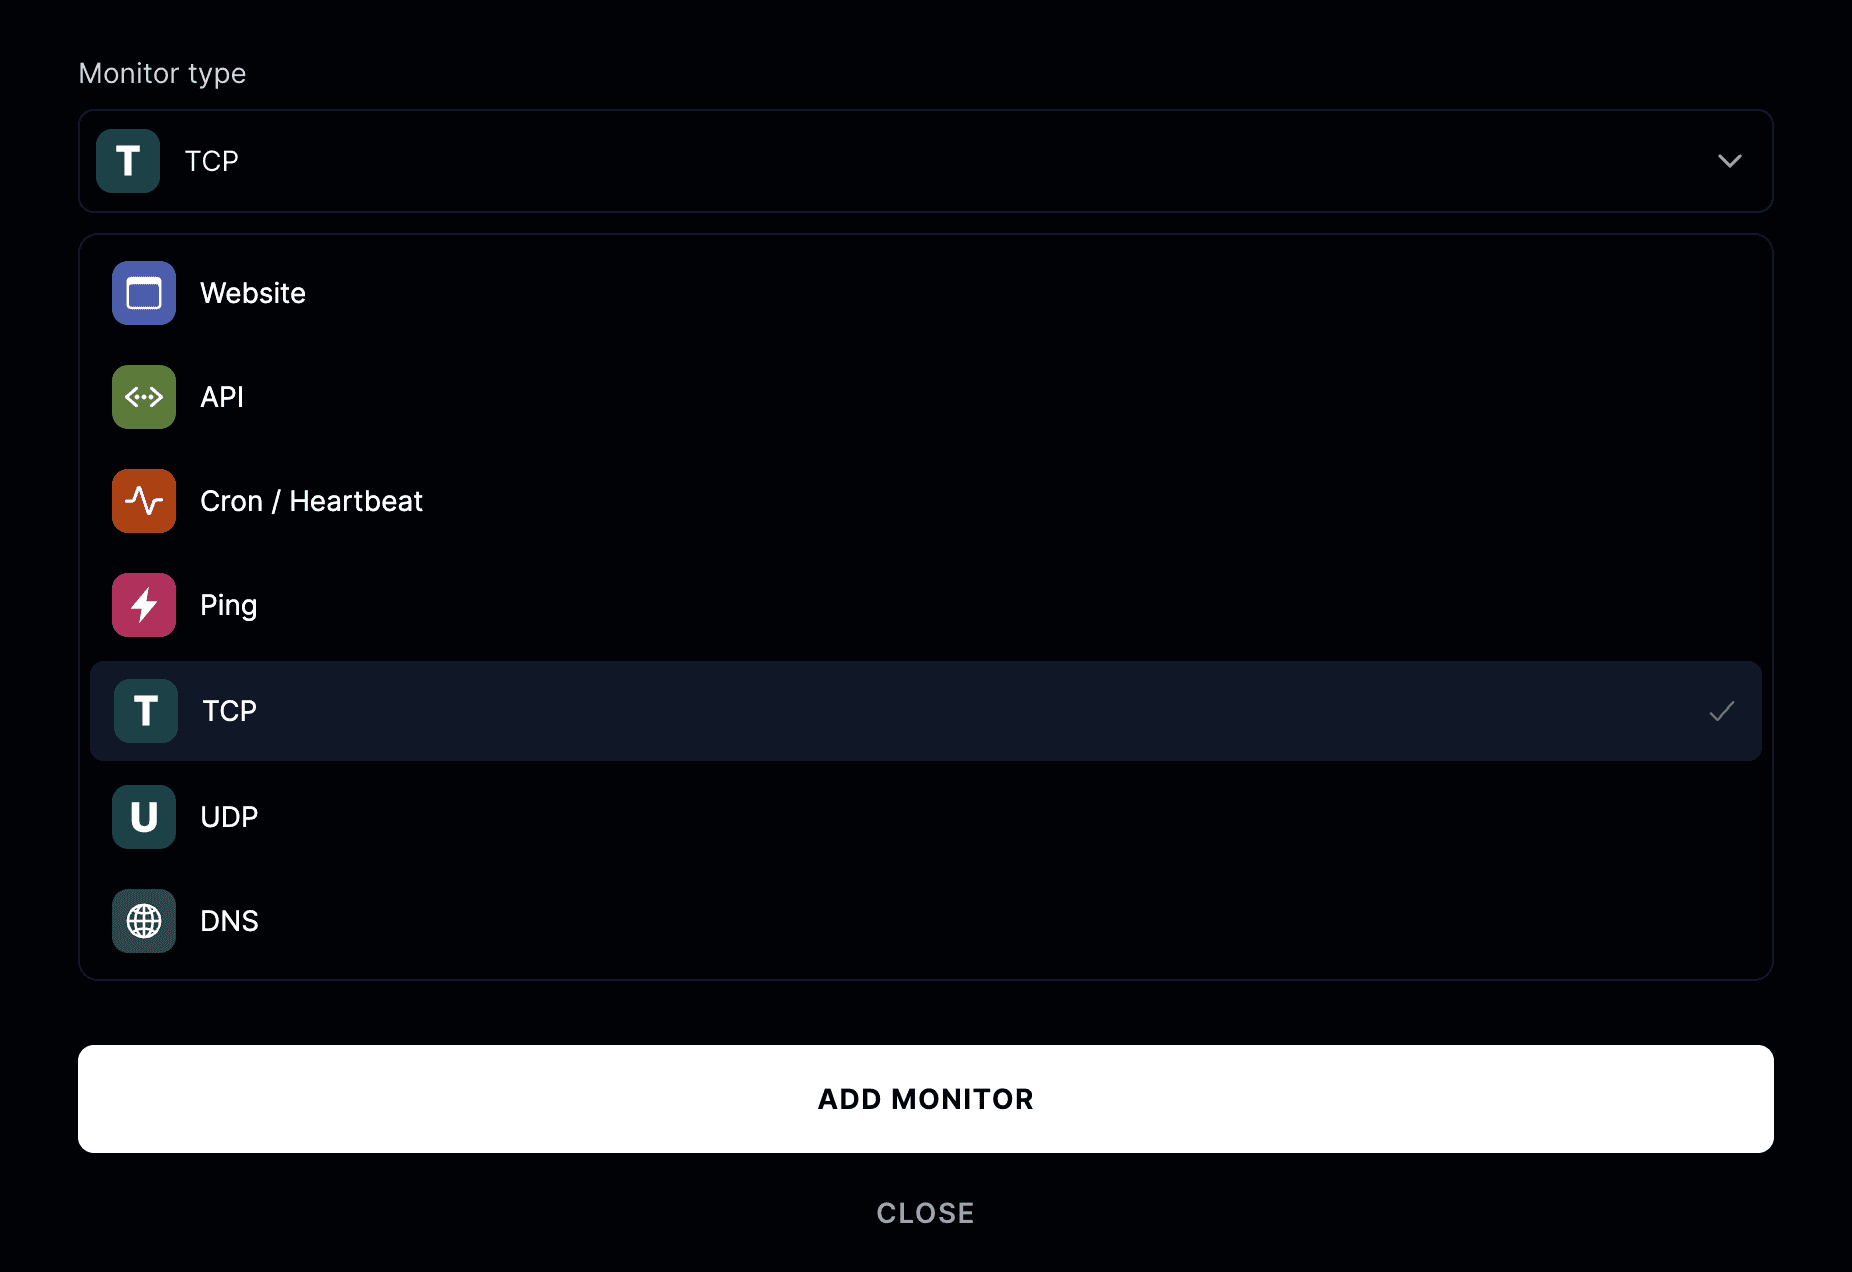
To create a new monitor, go to your project → Monitors → Add monitor.
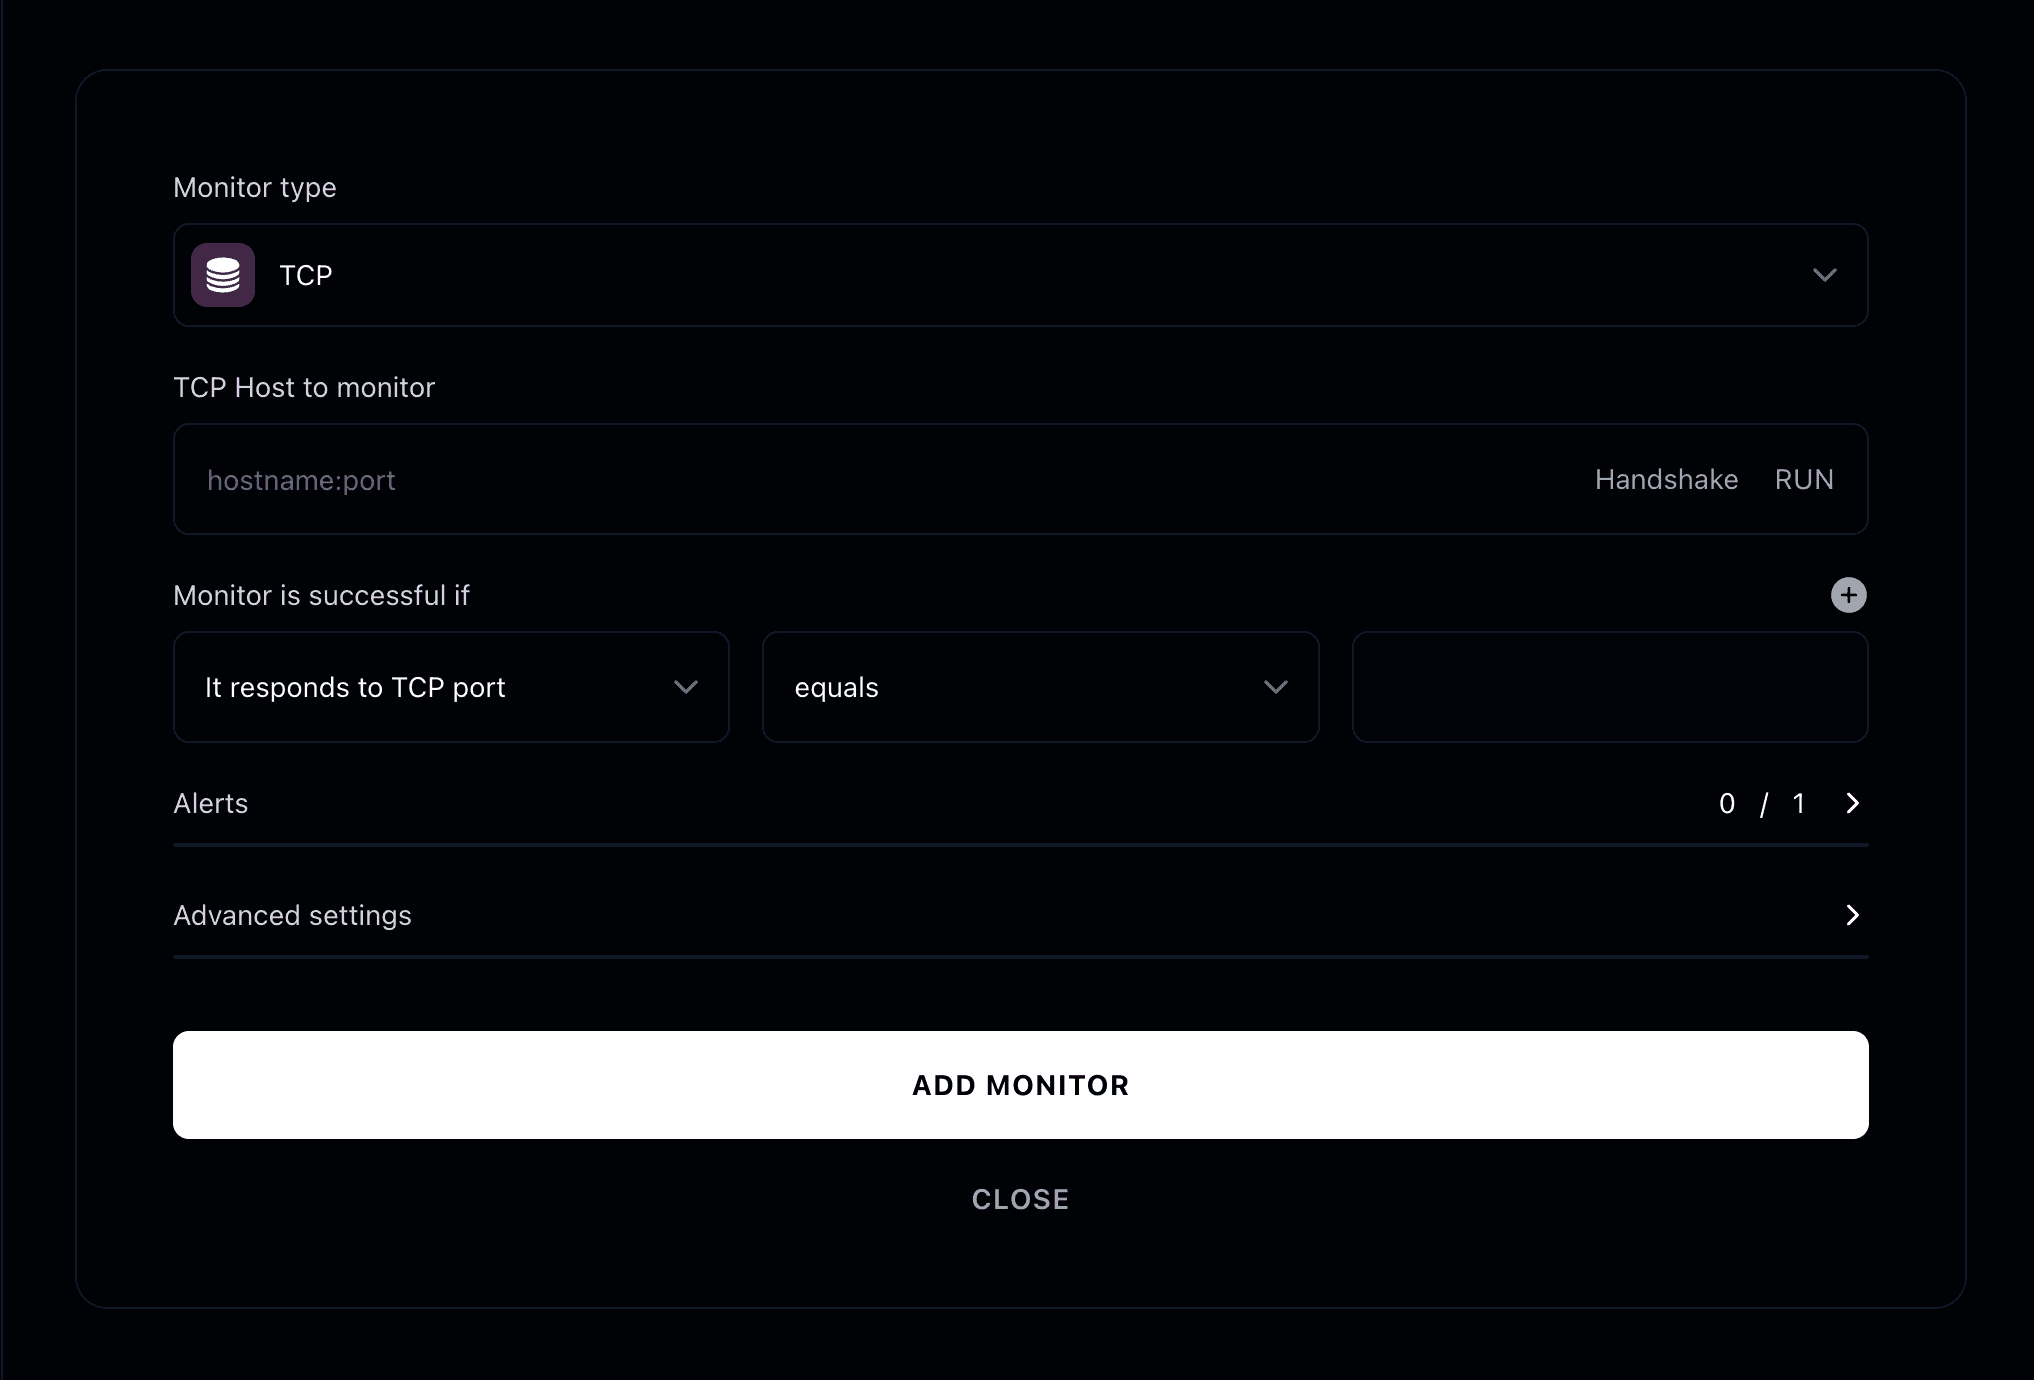
Monitor type
Choose TCP from the monitor type list.
Then enter the host:port you want to monitor.
For example:
db.yourcompany.com:5432 or mail.example.com:25
How TCP checks work
A TCP monitor attempts to open a socket connection to the target host and port at regular intervals.
If the connection succeeds, the monitor is marked as successful.
If the connection fails or is refused, the monitor is marked as down.
Setting Up a UDP Monitor
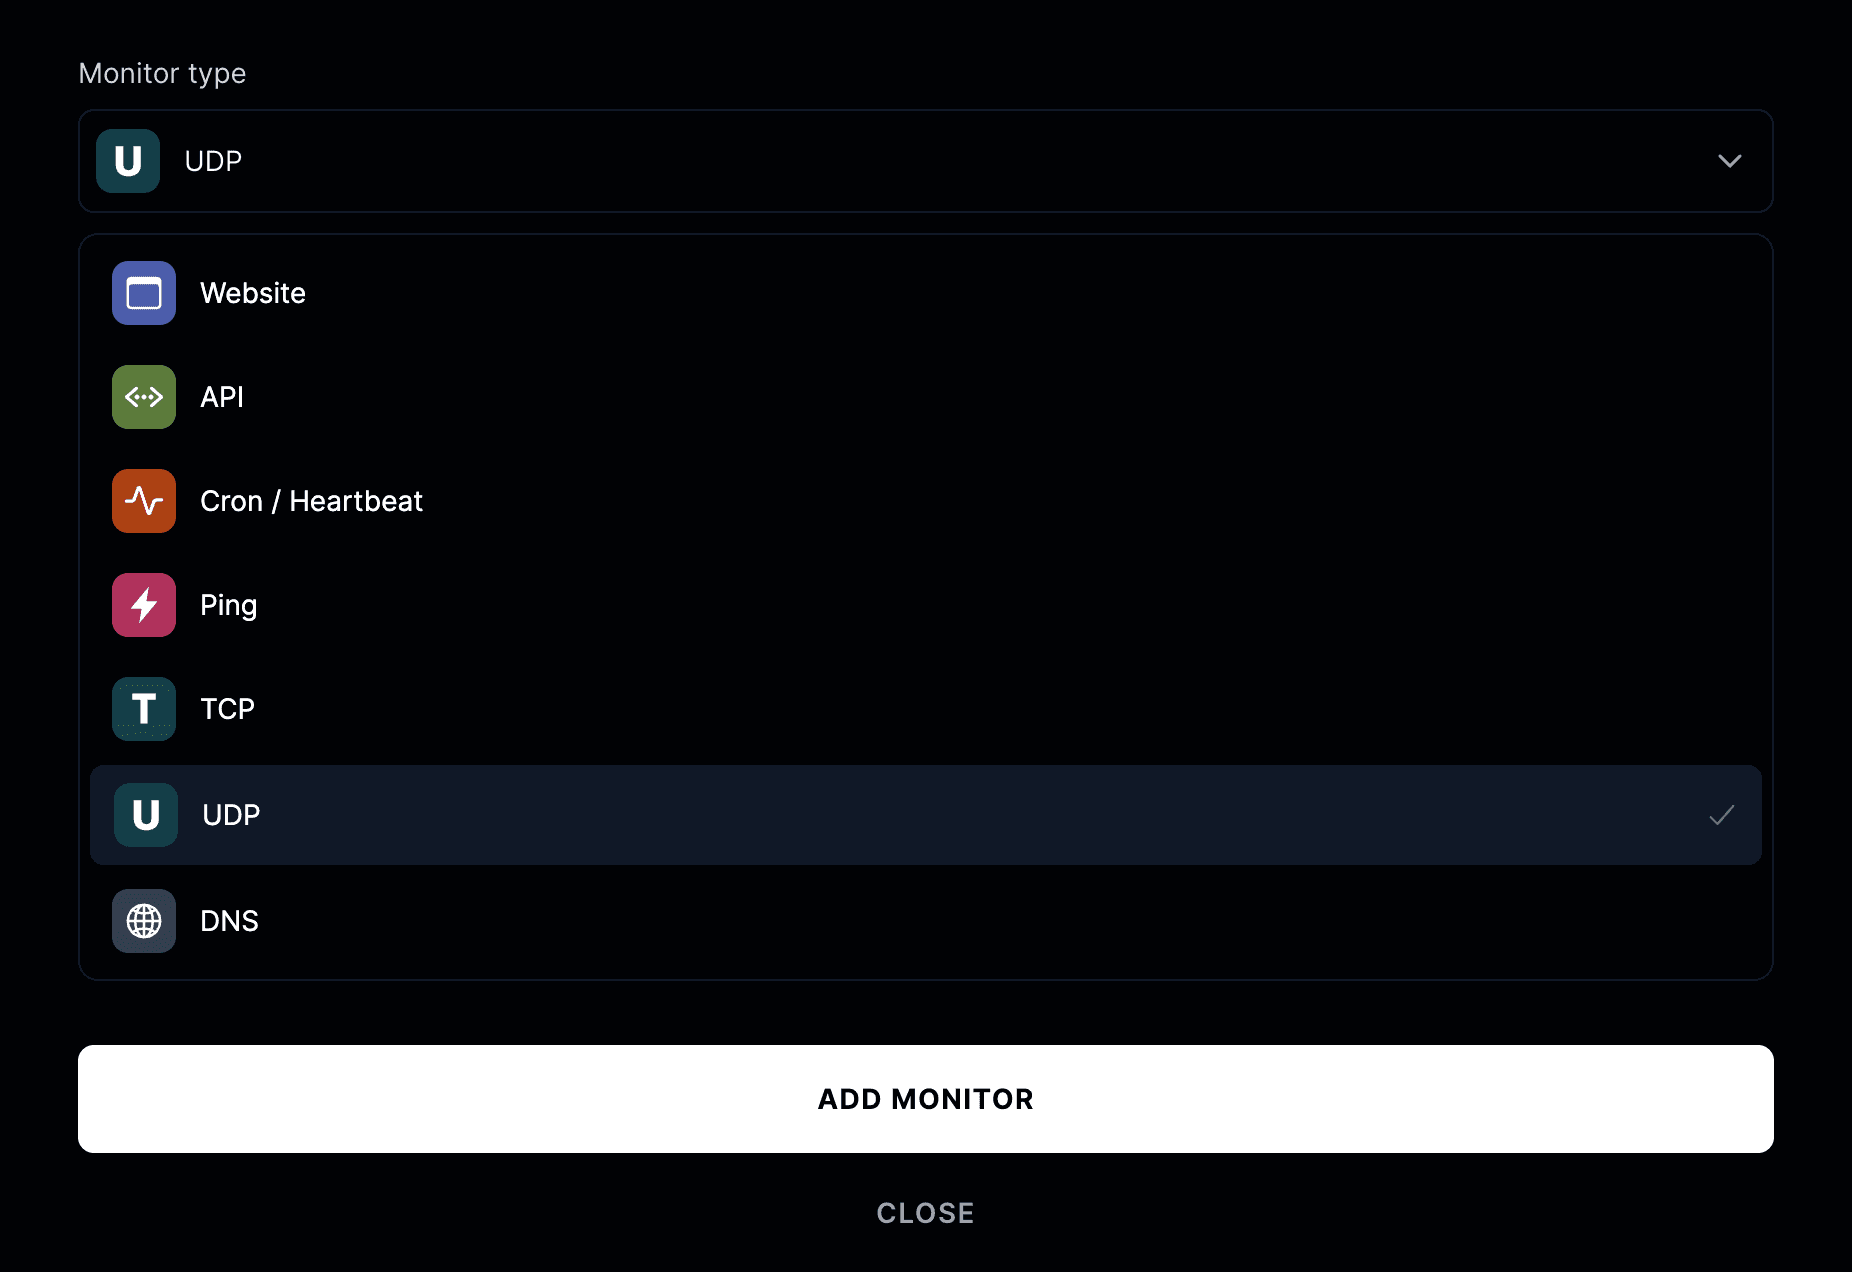
To add one, go to your project → Monitors → Add monitor.
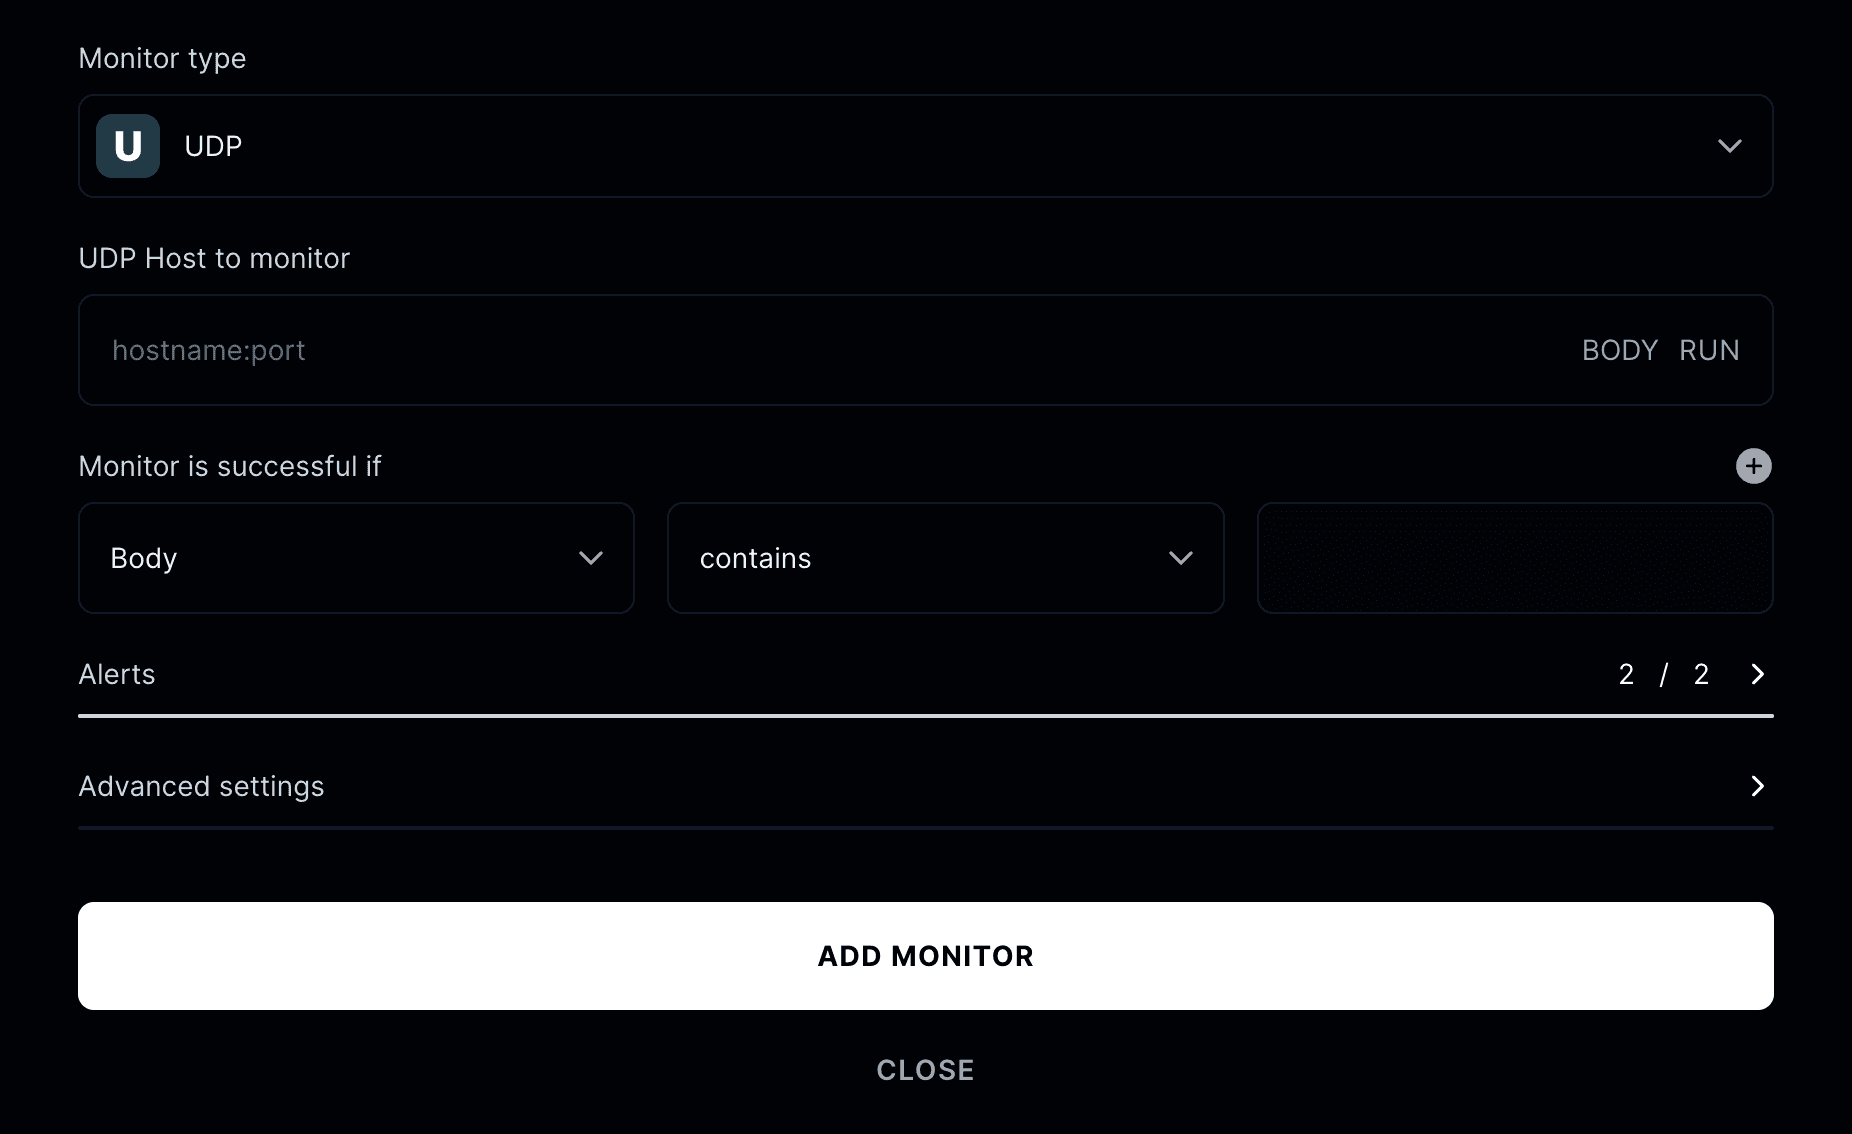
Monitor type
Select UDP from the list of available monitor types.
Enter the hostname or IP address and port you want to monitor. For example:
8.8.8.8:53 or 192.168.1.1:53
How UDP checks work
UDP monitors send packets to the configured host and port at set intervals.
If a valid response is received within the timeout period, the monitor is considered healthy.
If there's no response or too much packet loss, it's marked as down or degraded.
Advanced Options

- Friendly name: Add a label so you can easily identify your monitor.
- Run checks every: Decide how frequently to test the connection.
- Run from: Choose where to test from (United States, Canada, Europe, Asia).
- Add to status page: Display this service's uptime and response time publicly.
- When a monitor fails: Initiate an incident, notify subscribers, or publish to your status page.
- When a monitor recovers: Resolve incidents and automatically update your status page.