⌘ K
登入
免費開始
開始使用
監控
網站
API
Cron
Ping
TCP 和 UDP
DNS
警報
行動應用程式
事件回應
事件
維護
範本
一般公告
待命
升級政策
路由規則
Slack
狀態頁
公開頁面
私密頁面
指定對象
元件
第三方元件
公告
自訂
多語言
小工具
自有網域
訂閱者
指標
通知
電子郵件
簡訊
Webhook
X
Slack
Microsoft Teams
Discord
Google Chat
RSS 與 Atom
API
團隊
升級
單一登入
活動紀錄
刪除帳號
整合
Webhook
電子郵件
Better Uptime
Checkly
Datadog
Freshping
Grafana
HetrixTools
Jira
Zendesk
New Relic
PagerDuty
Pingdom
Prometheus
Runscope
Site24x7
StatusCake
Uptime Robot
Updown.io
Dynatrace
Google Cloud Monitoring
指標
Datadog
Pingdom
New Relic
Prometheus
API
監控
事件
事件更新
狀態頁
工作區
元件
團隊成員
維護
Maintenance updates
範本
一般公告
訂閱者
指標
使用者資料
故障
公開資料
私密頁面
監控整合
受眾群組
路由規則
升級政策
待命排班
用 Dynatrace 自動更新你的狀態頁
前往
Instatus
,在「整合」中選擇 Dynatrace
選擇自動建立與解決事件時要使用的範本
複製你頁面的 webhook URL
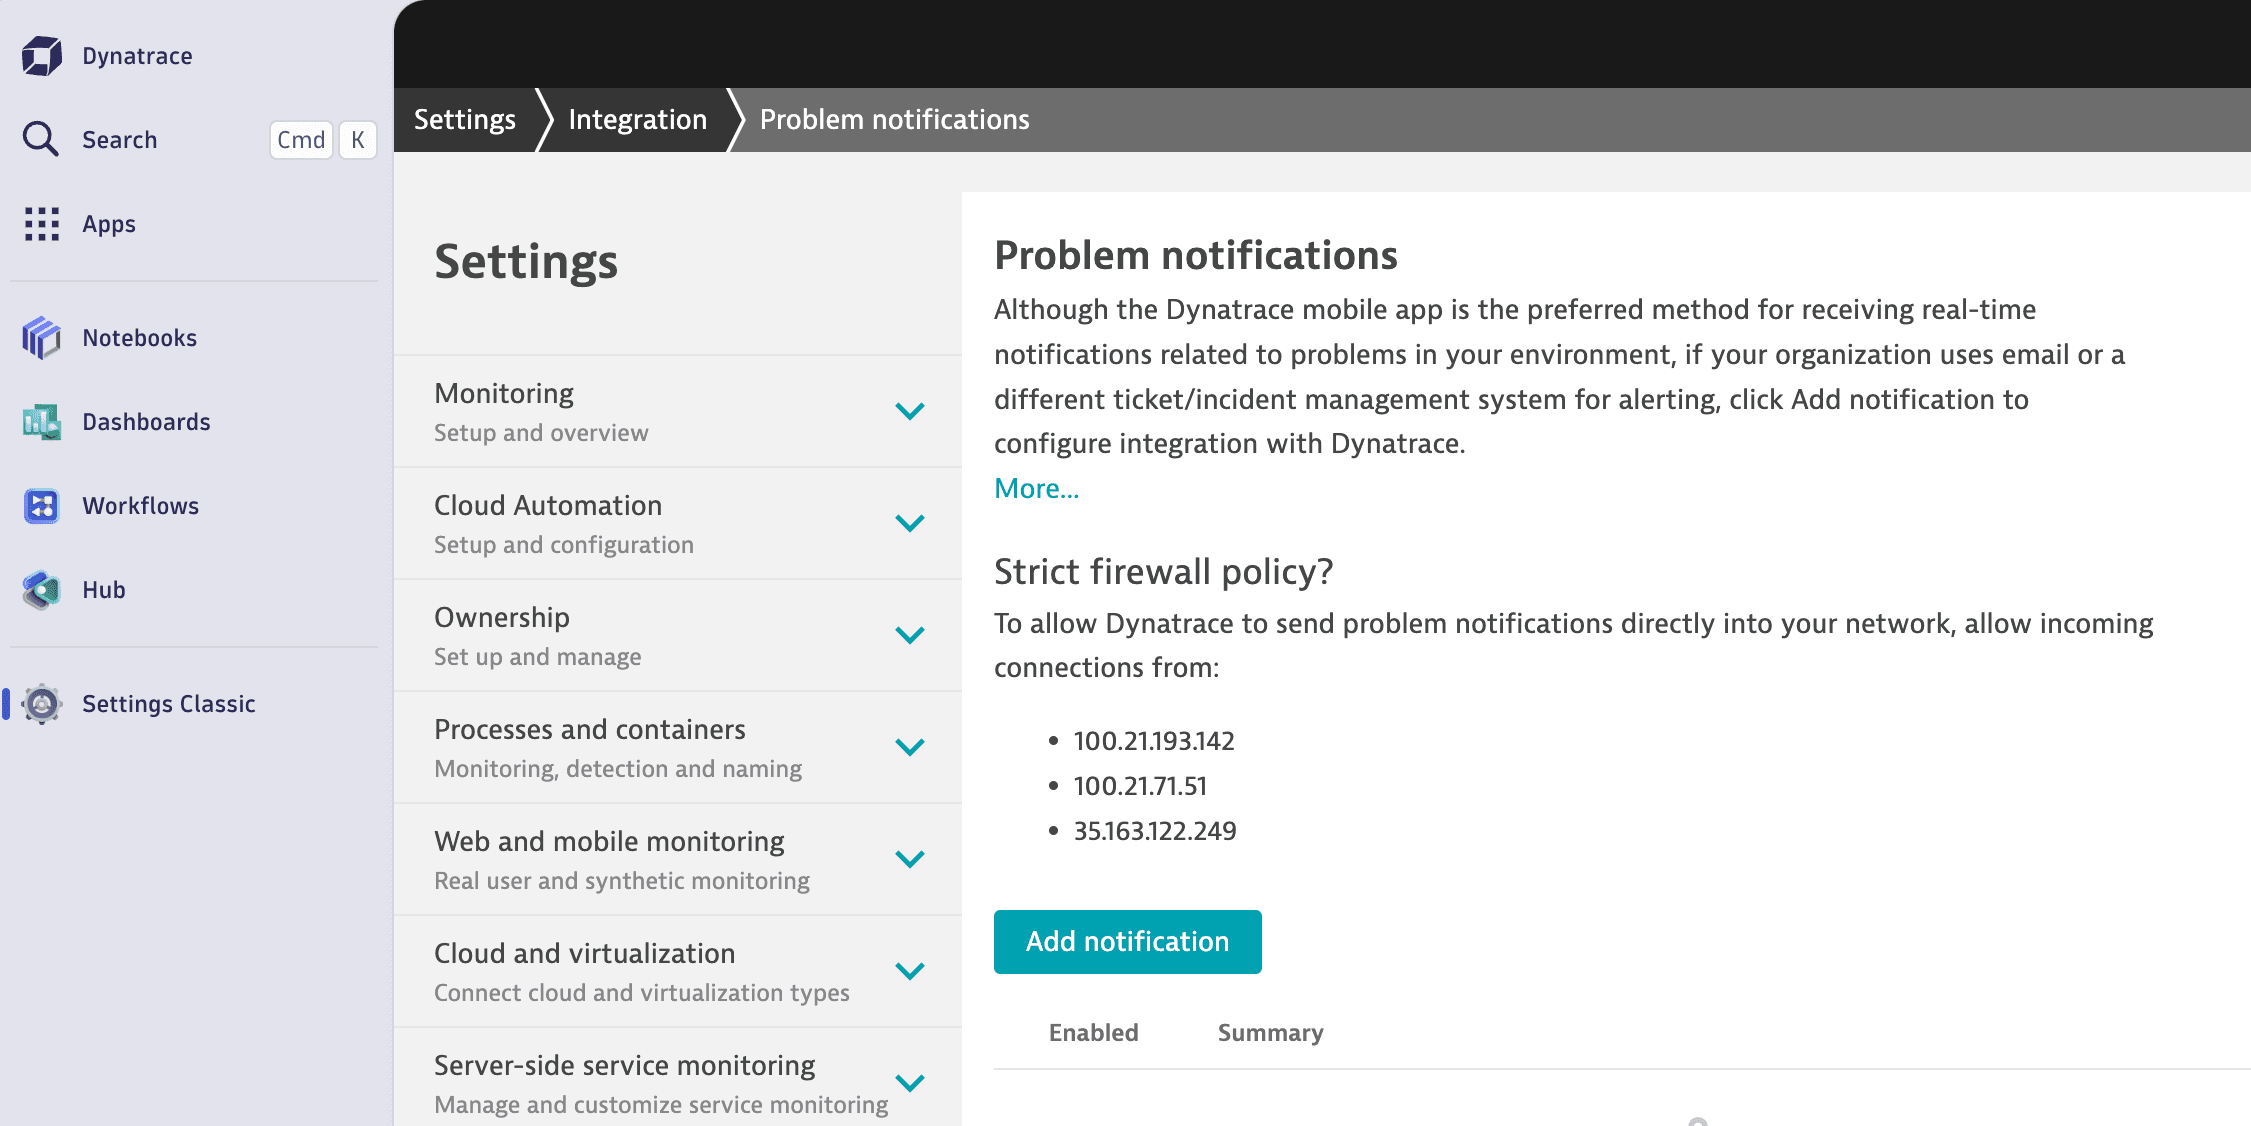
在你的 Dynatrace 儀表板中,前往 Settings Classic → Integrations → Problem notifications
點擊
Add notification
按鈕
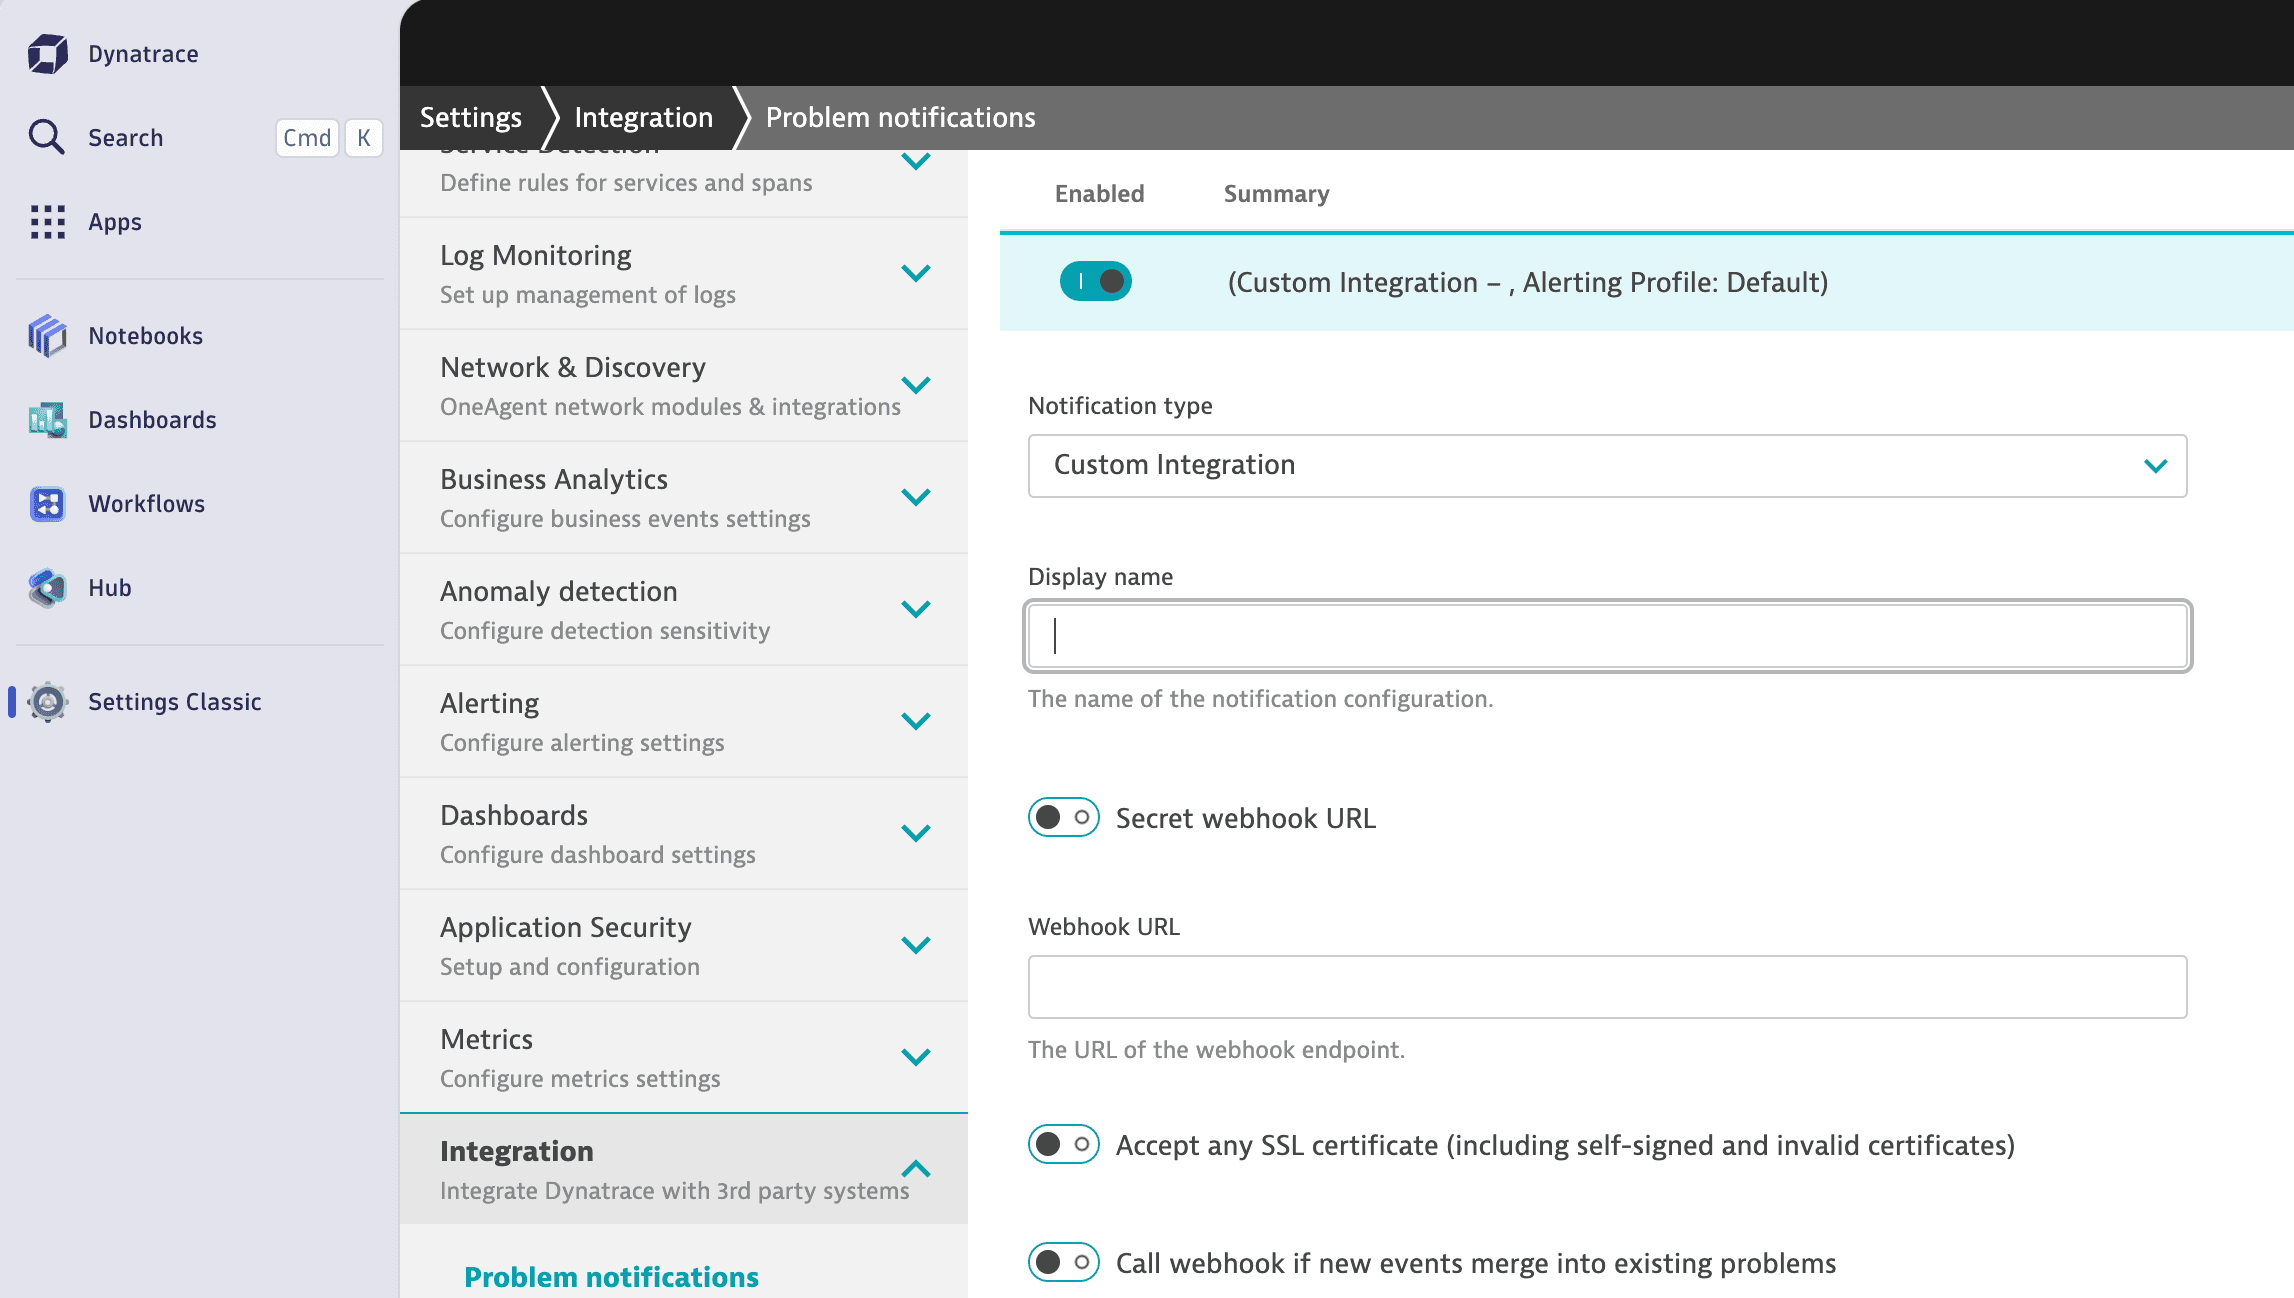
選擇
Custom integration
,並填入你複製的 webhook URL
完成了!👏
接下來
Google Cloud Monitoring + Instatus
依 Google Cloud Monitoring 警報自動建立事件。