⌘ K
登录
免费开始
开始使用
监控
网站
API
Cron
Ping
TCP 和 UDP
DNS
告警
移动应用
故障响应
事件
维护
模板
通用通知
值班
升级策略
路由规则
Slack
状态页
公开页面
私有页面
指定受众
组件
第三方组件
通知
自定义
多语言
小组件
自有域名
订阅者
指标
通知
邮箱
短信
Webhook
X
Slack
Microsoft Teams
Discord
Google Chat
RSS 与 Atom
API
团队
升级
单点登录
活动日志
删除账户
集成
Webhook
邮箱
Better Uptime
Checkly
Datadog
Freshping
Grafana
HetrixTools
Jira
Zendesk
New Relic
PagerDuty
Pingdom
Prometheus
Runscope
Site24x7
StatusCake
Uptime Robot
Updown.io
Dynatrace
Google Cloud Monitoring
指标
Datadog
Pingdom
New Relic
Prometheus
API
监控
事件
事件更新
状态页
工作区
组件
团队成员
维护
Maintenance updates
模板
通用通知
订阅者
指标
用户资料
故障
公开数据
私有页面
监控集成
受众分组
路由规则
升级策略
值班排期
用 Dynatrace 让状态页自动更新
前往
Instatus
,在集成中选择 Dynatrace
选择自动创建和解决事件时要使用的模板
复制你页面的 webhook URL
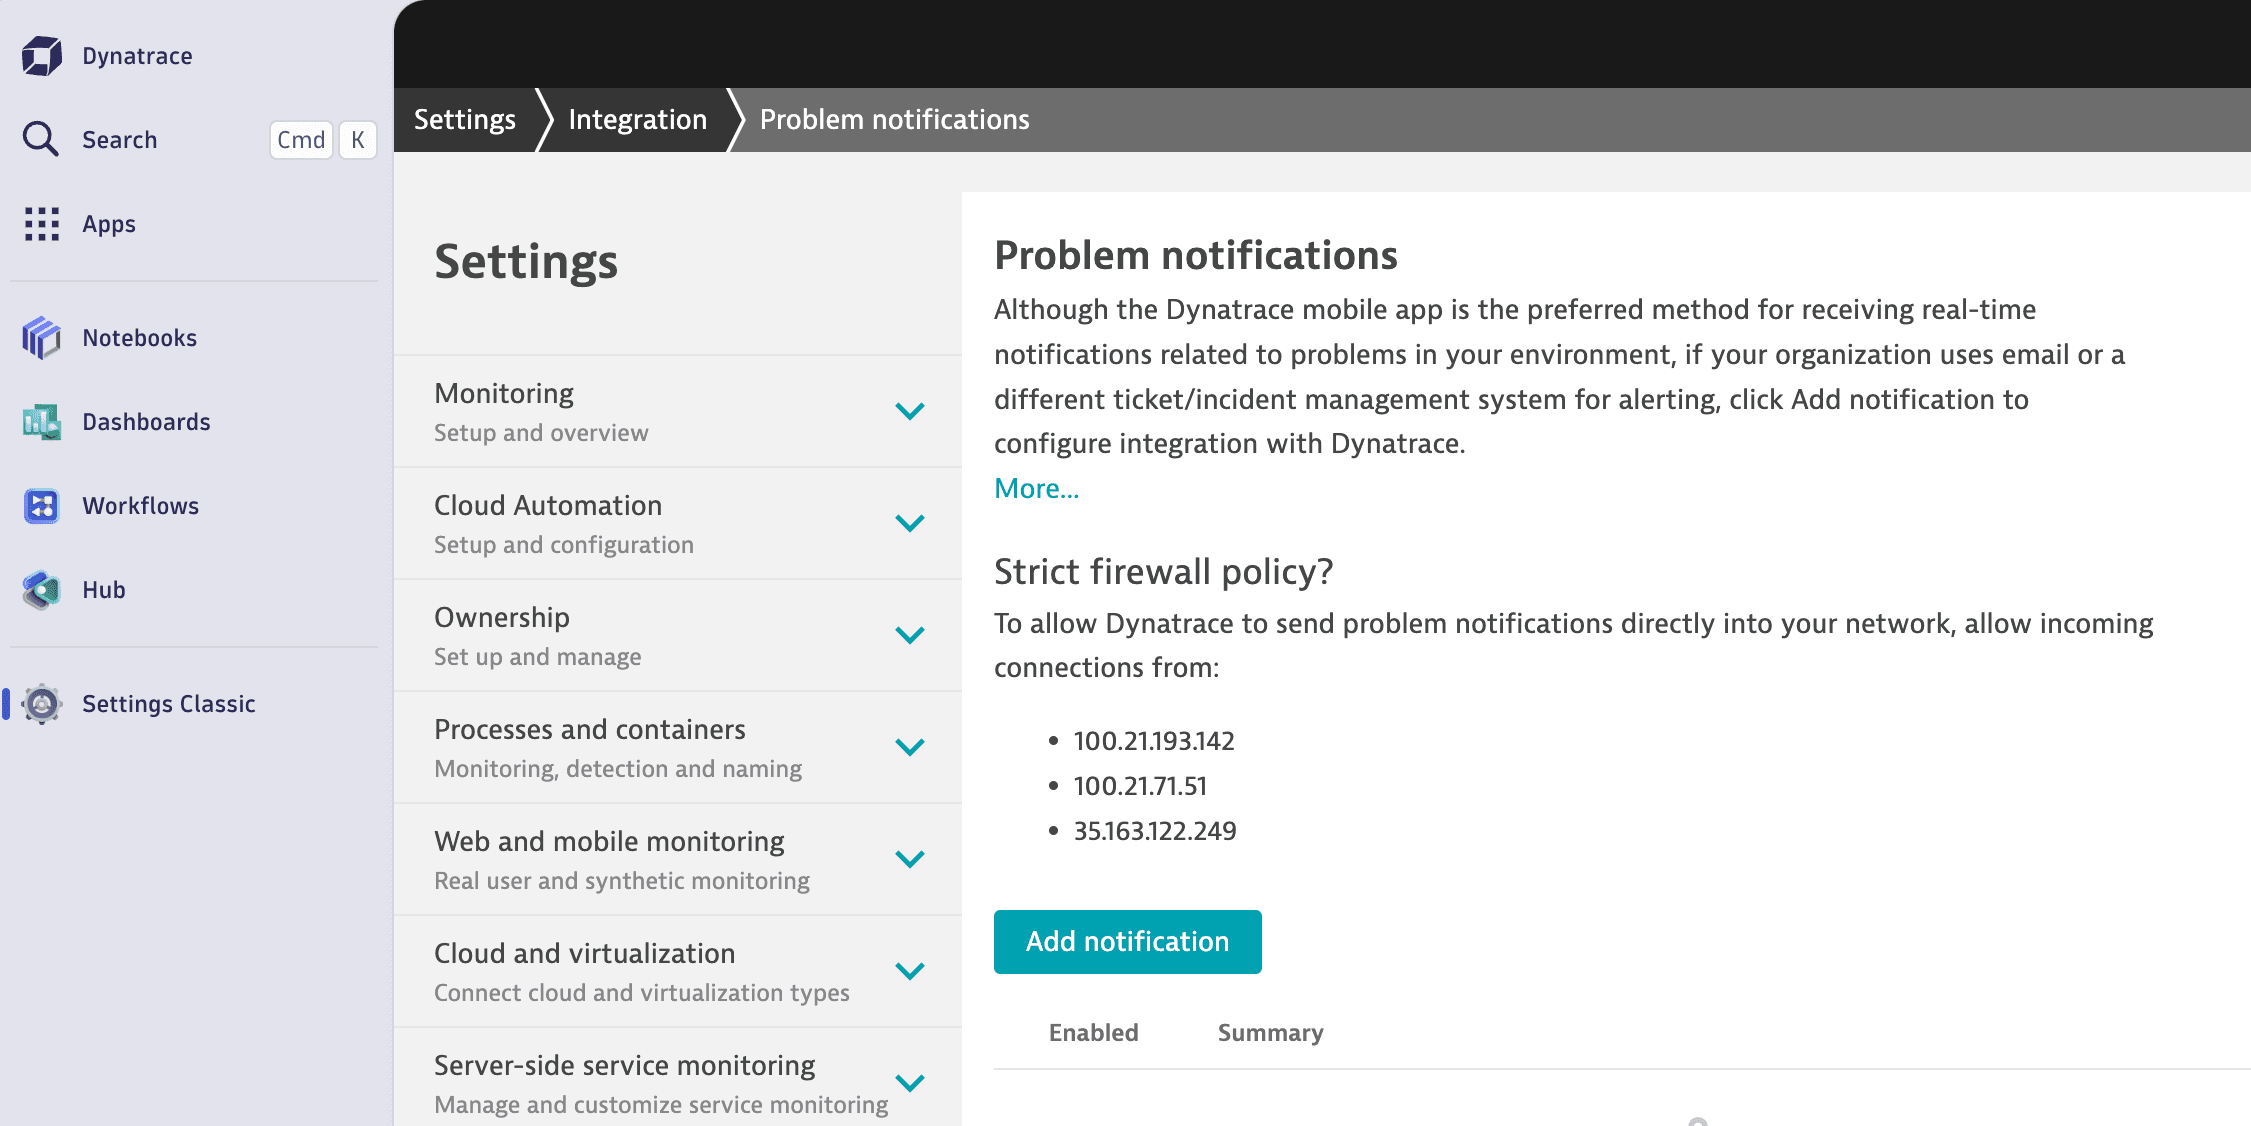
在 Dynatrace 控制台中,进入 Settings Classic → Integrations → Problem notifications
点击
Add notification
按钮
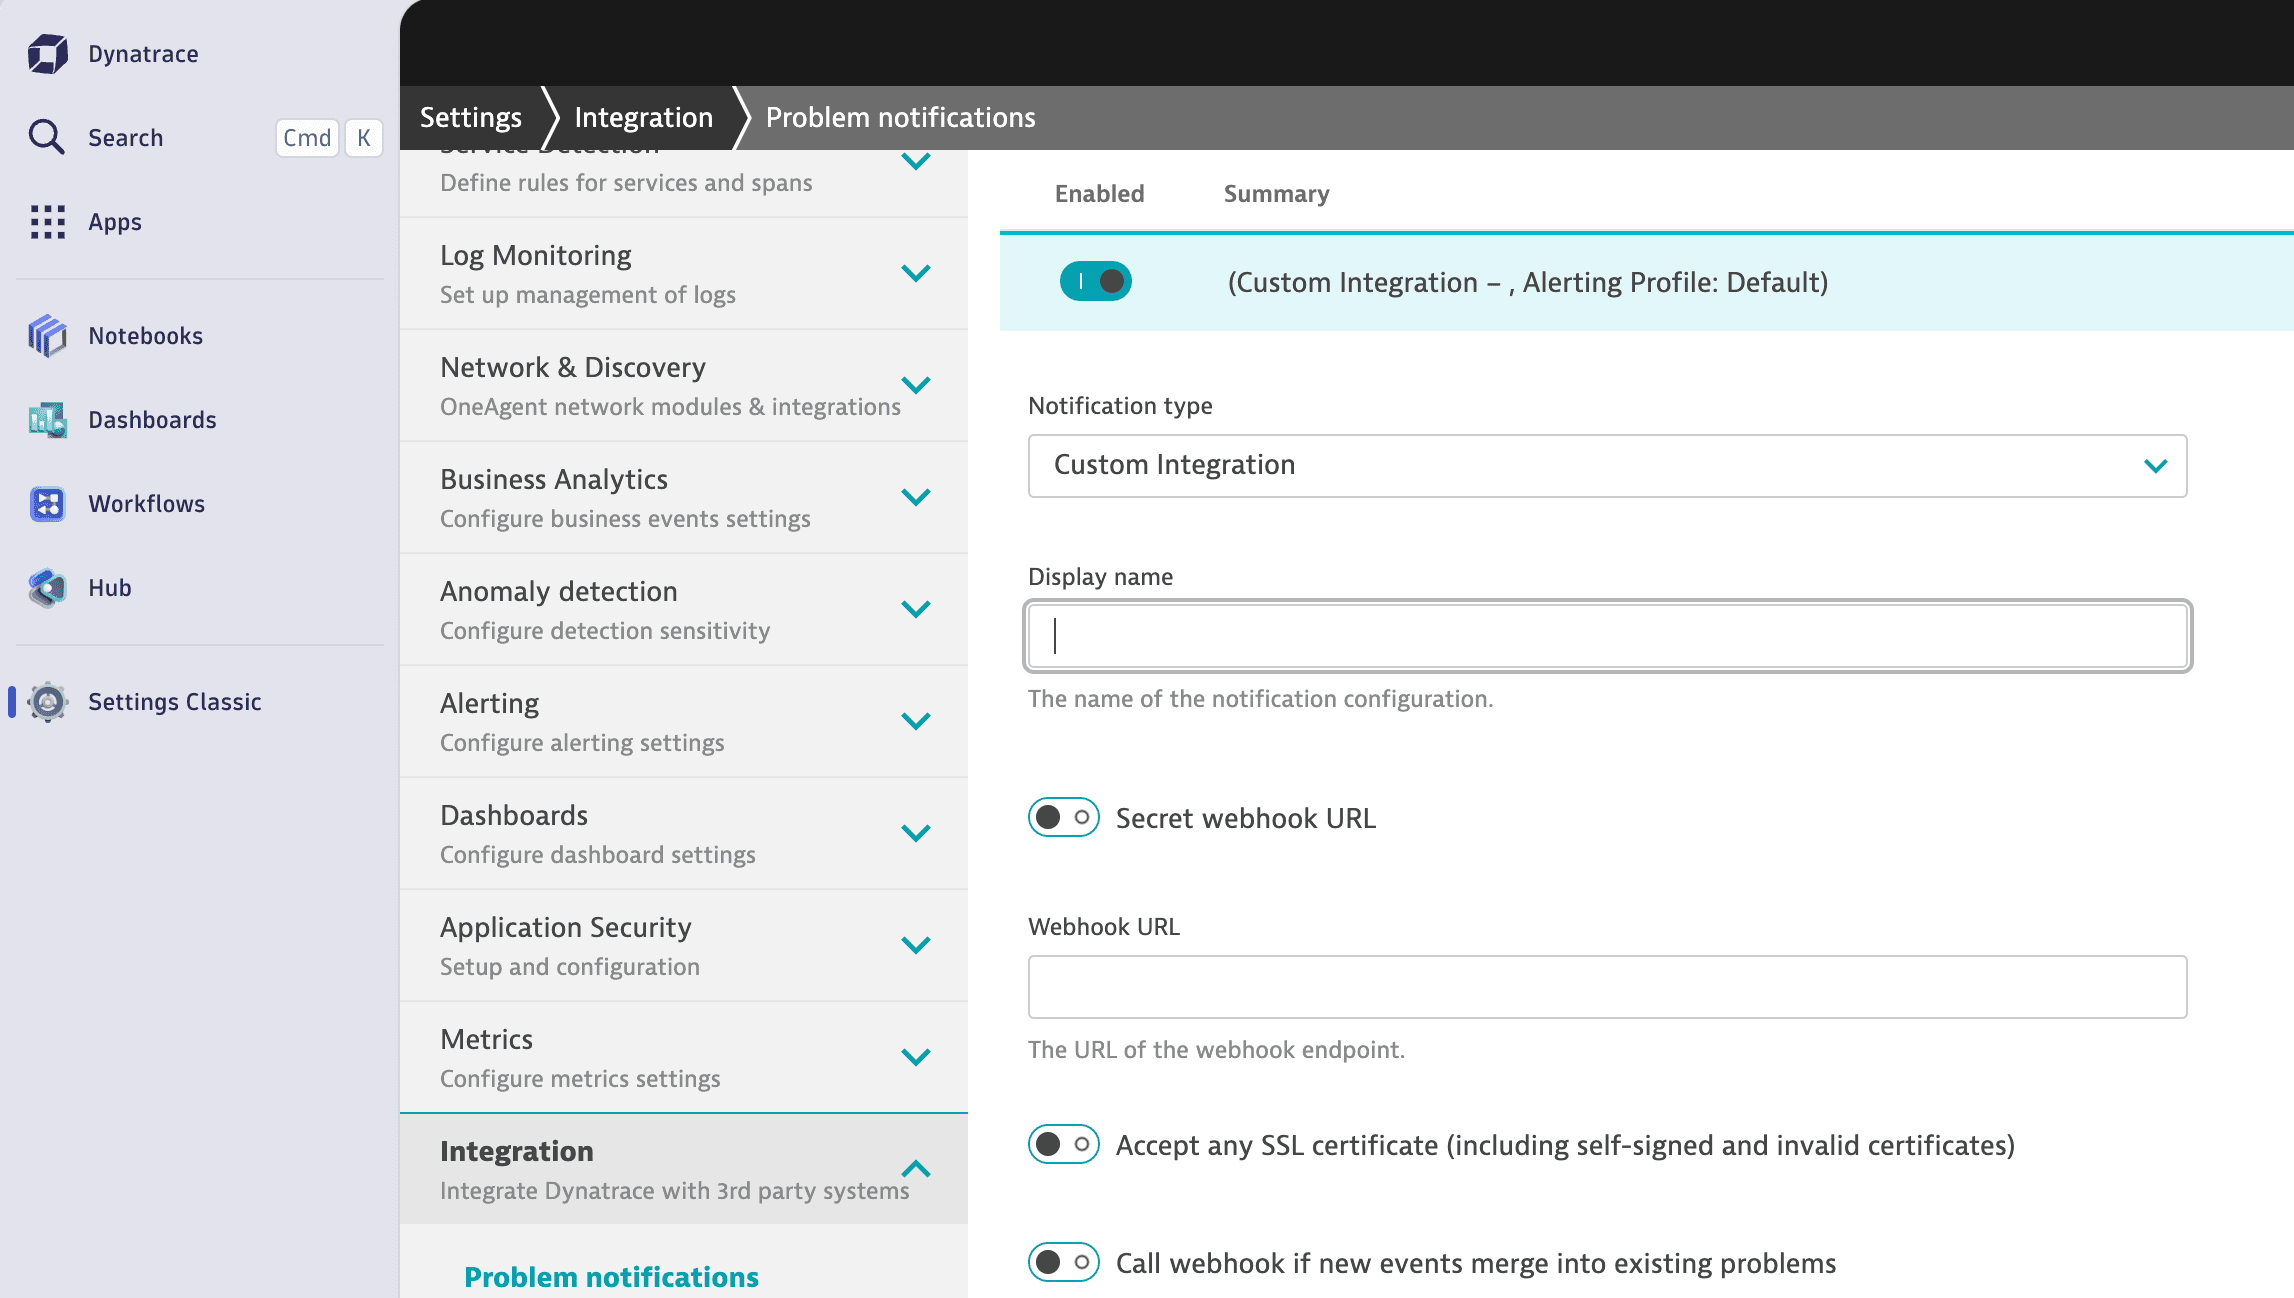
选择
Custom integration
,并填入你复制的 webhook URL
搞定!👏
接下来
Google Cloud Monitoring + Instatus
根据 Google Cloud Monitoring 告警自动创建事件。