

TCP Port Monitoring Explained [+ Best Practices]

Quick Summary
TCP port monitoring checks whether a service is reachable on a specific host and port. This guide covers what TCP port monitoring is, how to check a port manually, how to set up continuous TCP monitoring with Instatus and the best practices that help teams catch failures before users do. For more monitoring guides, visit the Instatus blog.
When a Port Goes Quiet and Your Homepage Stays Up
Your website can load perfectly while one critical service behind it stops accepting connections: checkout fails, a database stops listening on port 5432, and a cache on port 6379 drops connections.
From the outside, the homepage still looks healthy. Behind it, a critical service may already be failing.
That is why TCP port monitoring matters. It checks the service behind the port, not just the page in front of it. For teams that depend on databases, APIs, mail servers, queues or internal services, that difference matters.
Downtime gets expensive fast. ITIC's 2024 survey found that the average cost of one hour of downtime exceeds $300,000 for over 90% of mid-size and large enterprises.
In this Instatus guide, we'll show you how TCP port monitoring works, how to check a port yourself and how to monitor ports continuously with alerts and status page updates.
Why Listen to Us?
At Instatus, we build monitoring and status pages for SaaS, DevOps and developer teams. Companies like Sketch, Dovetail, Airbyte, Harvard, Deno, Wistia and Modern Treasury use Instatus to monitor services, manage incidents and keep customers updated. That gives us a practical view of how port failures happen, how teams respond and where continuous monitoring helps most.
What Is TCP Port Monitoring?
TCP port monitoring is the practice of checking whether a service accepts connections on a specific TCP port. A monitor tries to open a connection to a host and port, then reports whether the service is reachable.
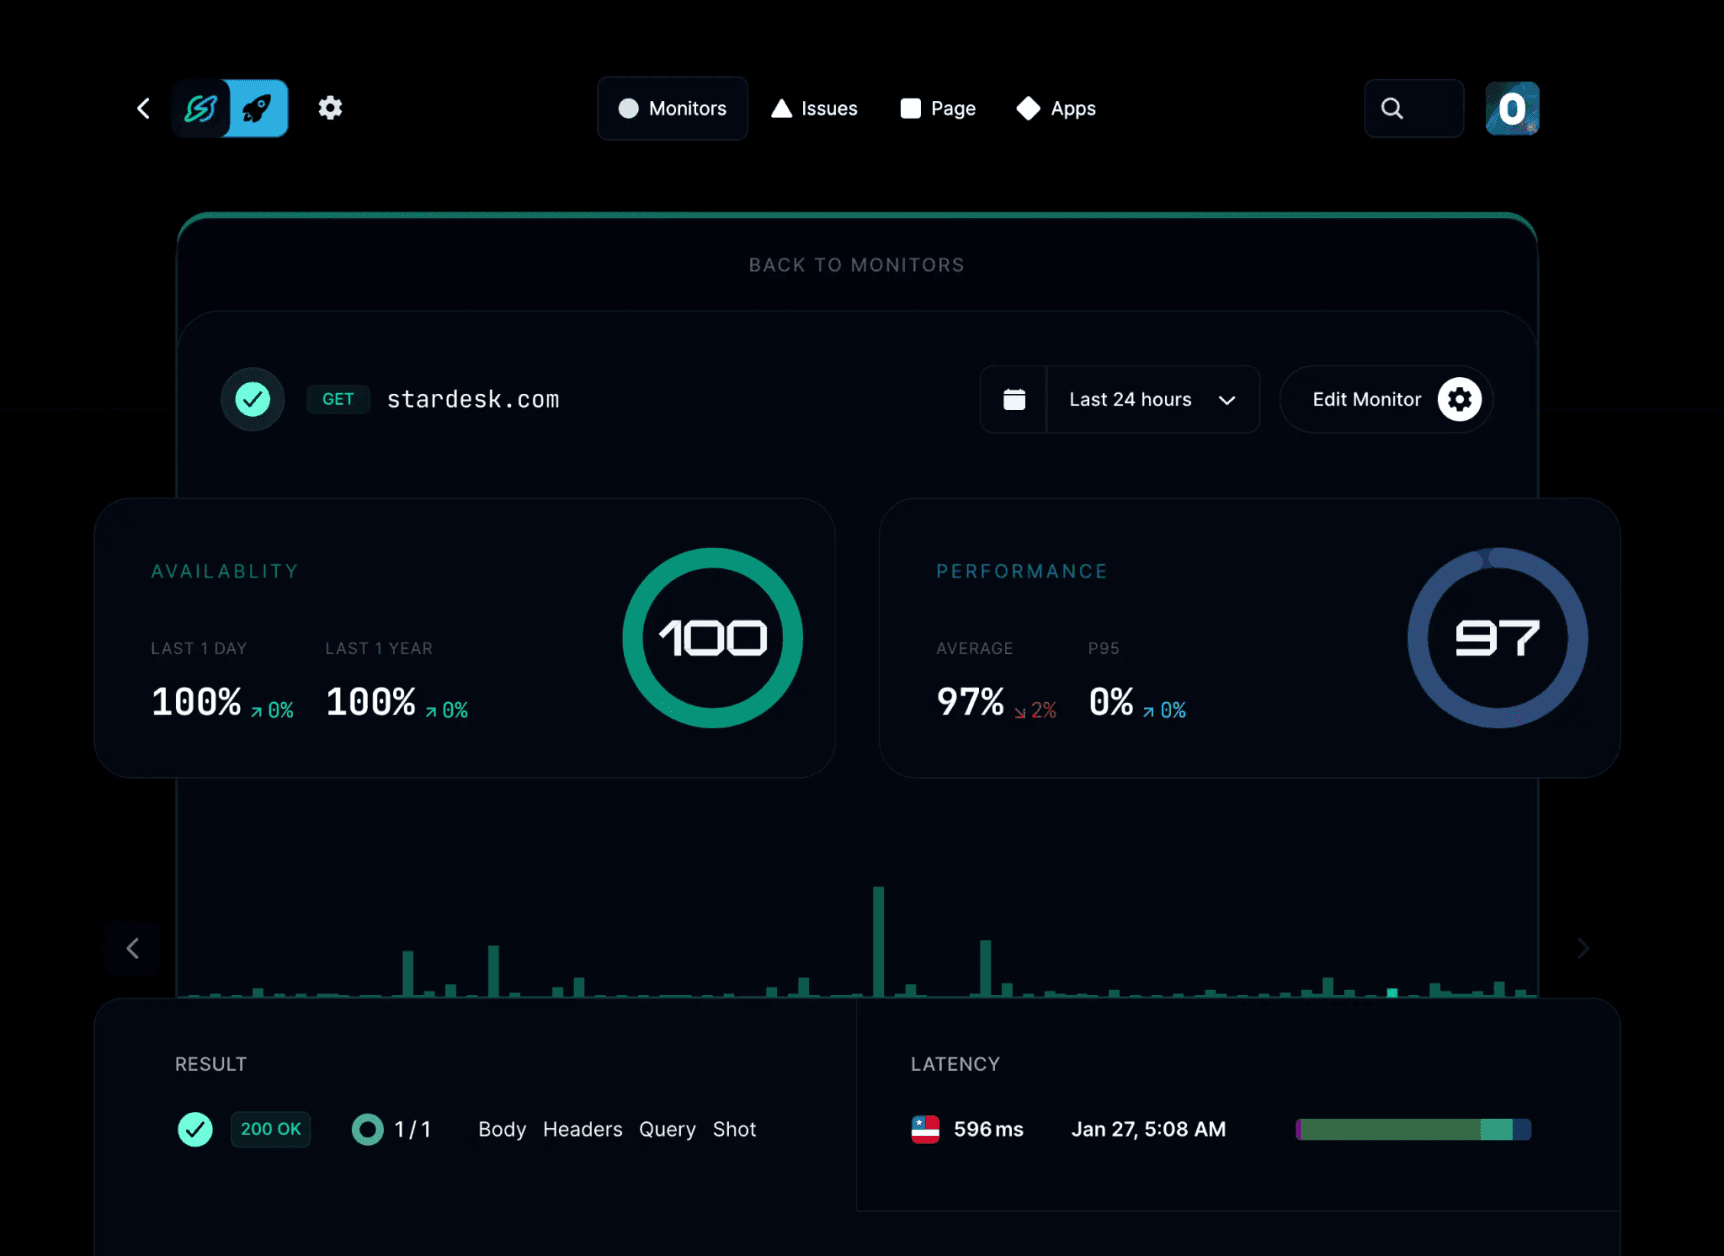
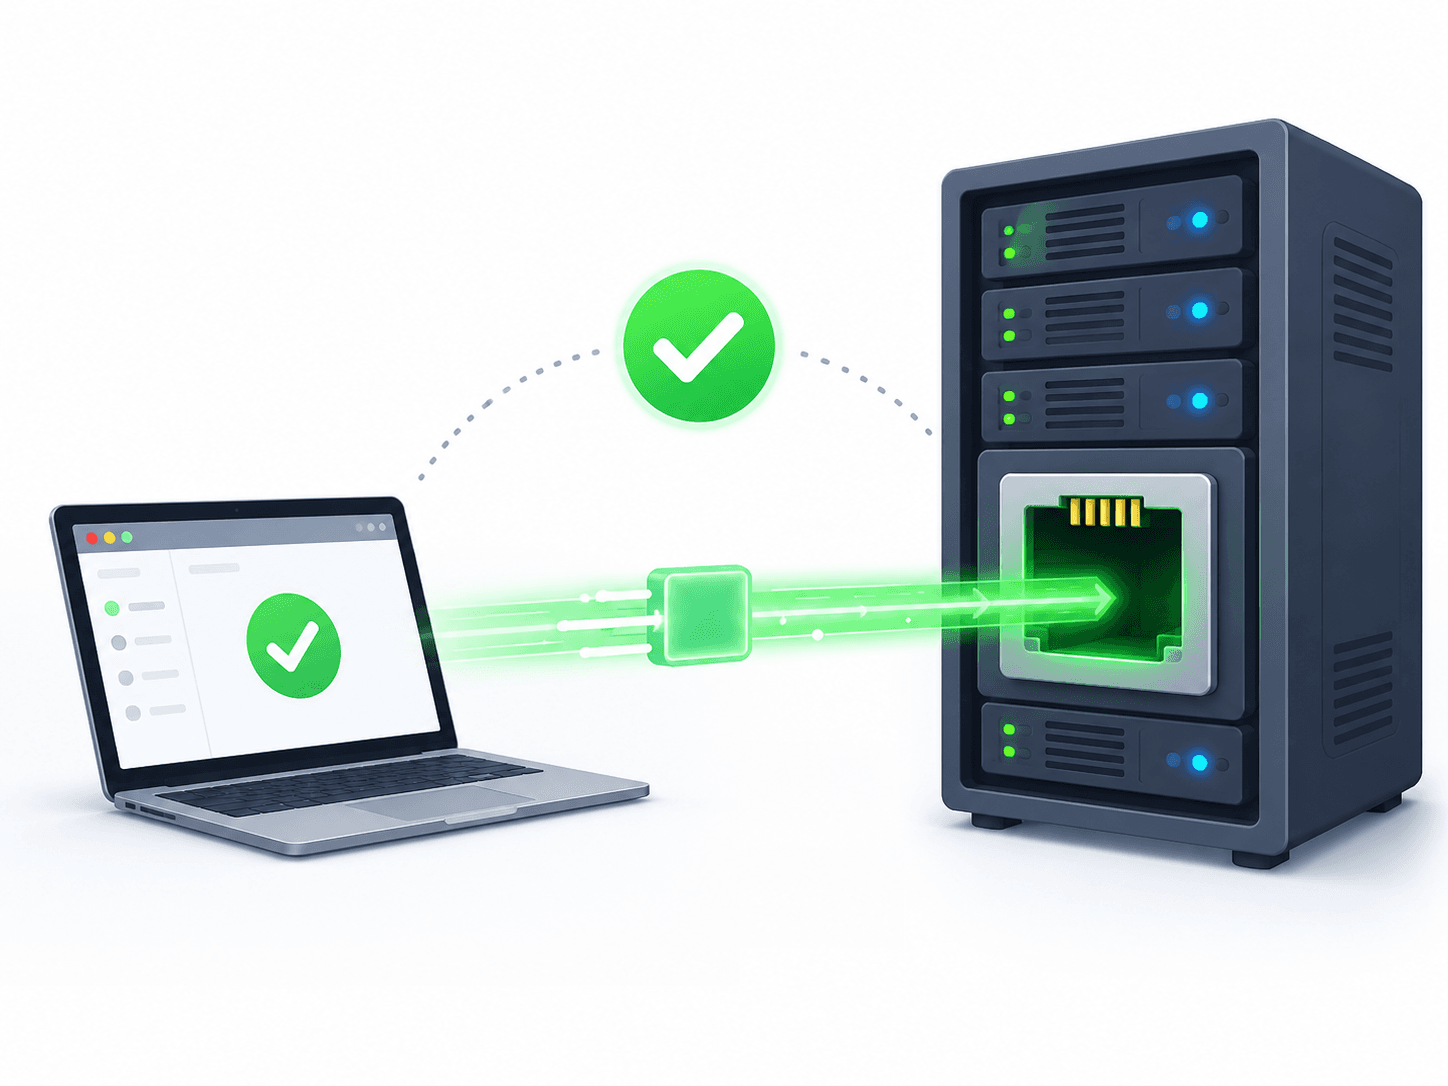
The result tells you the port's state. If the connection succeeds, the port is reachable. A refused connection usually means the host is reachable but no service is accepting connections on that port, while a timeout can point to filtering, routing issues or an unreachable host. Instatus TCP & UDP monitoring works this way by testing whether a host and port are reachable from multiple global locations.
From a monitor or scanner's perspective, a TCP port commonly appears in one of three states:
- Open: The service accepts the connection.
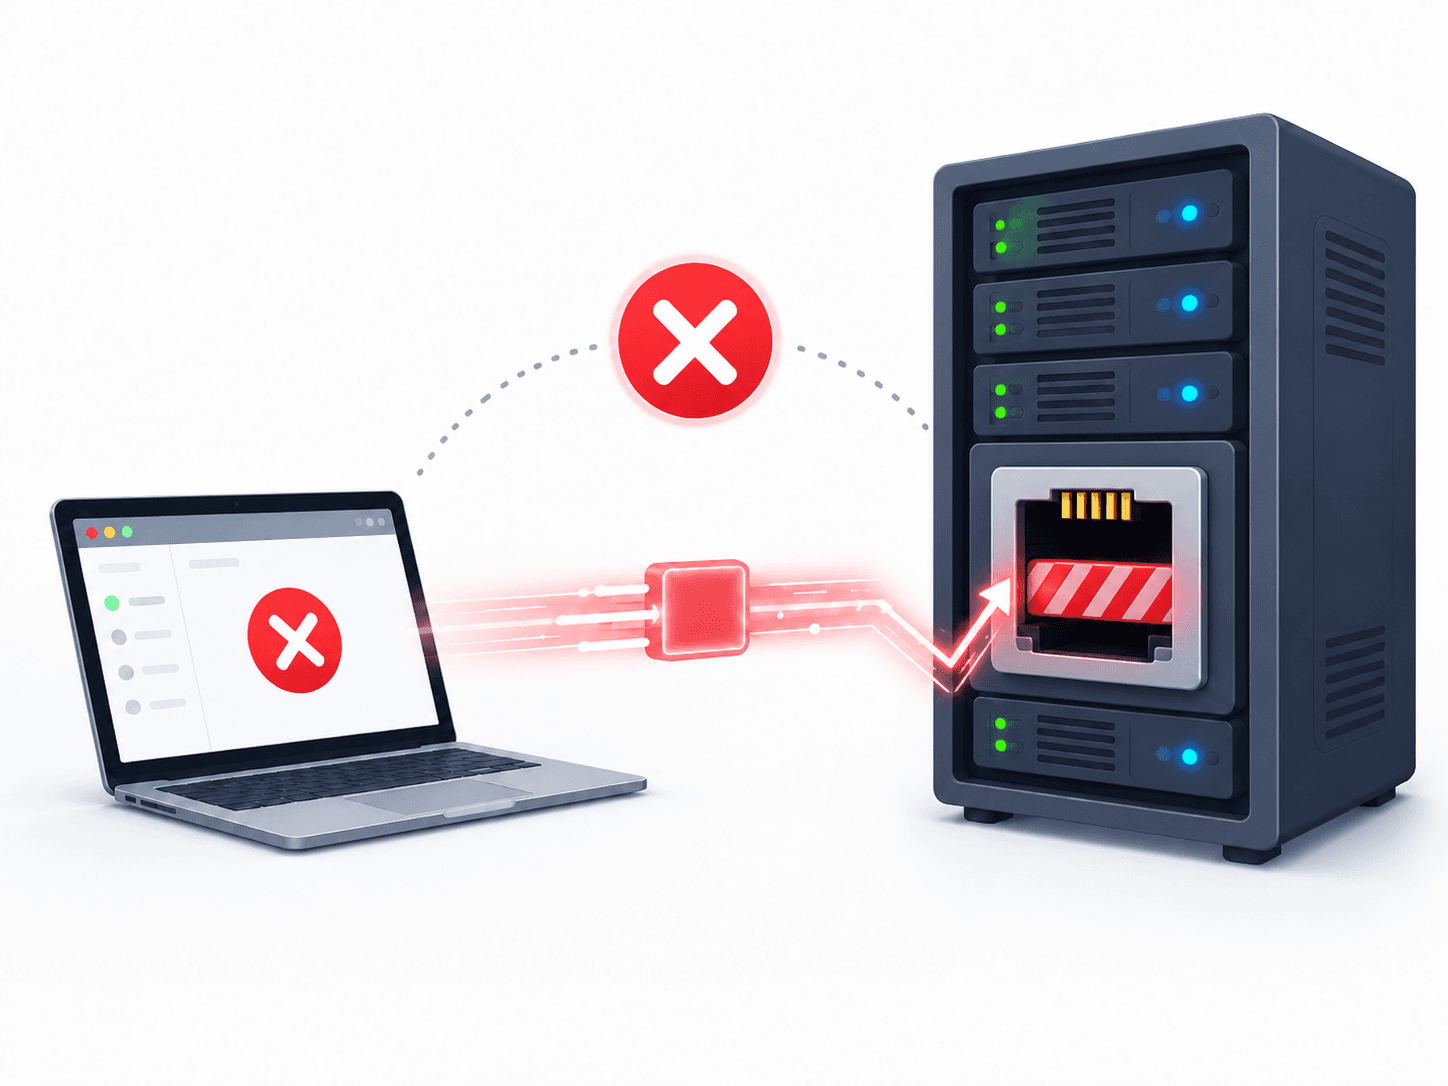
- Closed: The host is reachable, but nothing is listening on that port.
- Filtered: A firewall or network rule prevents the scanner from determining whether the port is open, often because probes are dropped or blocked.
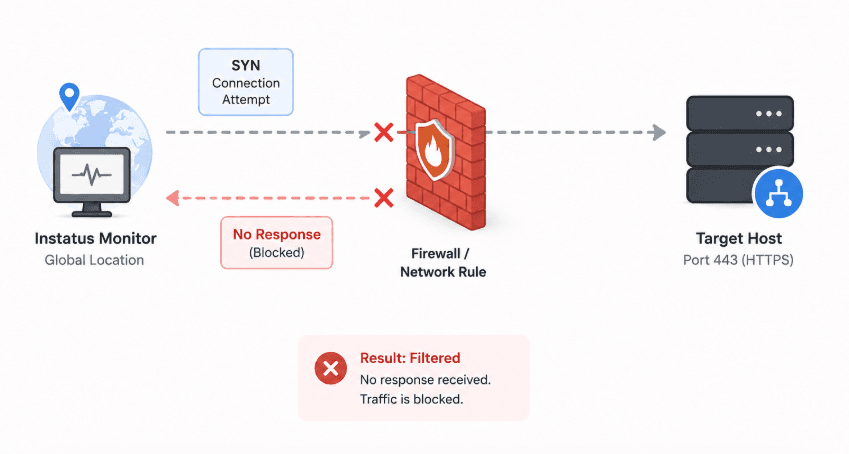
TCP is connection-oriented, which makes it easier to confirm than UDP. UDP has no handshake, so UDP monitoring usually depends on whether the service responds as expected.
TCP port monitoring is one part of broader server monitoring, alongside checks like DNS monitoring, ping monitoring, API monitoring and website monitoring. It tells you whether the service behind the port is actually reachable, which a basic page load or ping check can miss.
Why TCP Port Monitoring Matters
A page can look healthy while the service behind it is down. That gap is exactly what TCP port monitoring closes.
Here is why it earns a place in your stack:
- Catch Failures Your Website Hides: When your Redis cache on port 6379 stops responding, your homepage may still load while sessions quietly break. A port check catches it in seconds.
- Find Problems Before Users Do: Port monitoring runs on a schedule, so you learn about an issue before the first support ticket lands.
- Keep Your Uptime Numbers Honest: Every recorded failure sharpens your reliability data. If you report against an SLA, clean port data keeps those numbers accurate. Here is how to calculate uptime.
- Cut Support Load: Fewer surprise outages mean fewer angry tickets and less firefighting.
Take a team running a payment service. The API port fails for eight minutes during a flash sale. Without a port monitor, they hear about it from customers. With one, they get an alert on minute one and fix it before it spreads. That difference is the whole point.
How to Monitor a TCP Port (Step by Step)
There are two ways to monitor a TCP port. You can check it by hand when you need a quick answer, or you can set up continuous monitoring that watches the port for you and alerts your team the moment it fails. Most teams need both.
We'll cover the manual commands first, then show you how to automate the whole thing.
Method 1: Quick Manual Checks
Manual checks are perfect for a fast yes-or-no answer. Is the port open right now? The right command depends on your operating system and installed tools.
- Check a port with telnet. Telnet is the simplest option. Point it at a host and port:
telnet example.com 443
If the port is open, you'll usually see a blank screen or connection message. If the port is closed or filtered, the connection fails or hangs.
- Check a port with netcat. Netcat is cleaner for quick shell checks and scripts:
nc -zv example.com 443
The -z flag checks without sending data and -v prints the result.
- Check a port on Windows. Windows users can use PowerShell:
Test-NetConnection example.com -Port 443
This tests TCP connectivity to the host and port from your Windows machine.
- Scan with nmap. For a fuller check, use nmap:
nmap -p 443 example.com
Nmap can report whether a port is open, closed or filtered, and it also reports less common states such as unfiltered, open|filtered and closed|filtered. That makes it useful when you need to tell a dead service apart from a firewall or routing issue.
- See what is listening locally. To confirm a service is bound to a port on your own server, use:
ss -tlnp
This lists TCP ports in the listening state, along with the process that owns them.
Manual checks have one limit. They only show the state of a port at that moment. A port that is open now can fail five minutes later, and no command in your terminal will catch it.
Method 2: Set Up Continuous TCP Monitoring With Instatus
To catch failures the moment they happen, you need a monitor that checks the port on a schedule and alerts you when it stops responding. This is native uptime monitoring, and it is built into Instatus.
Here is how we set it up:
Step 1: Create a TCP Monitor
In your Instatus dashboard, open your project, go to Monitors and choose Add Monitor.
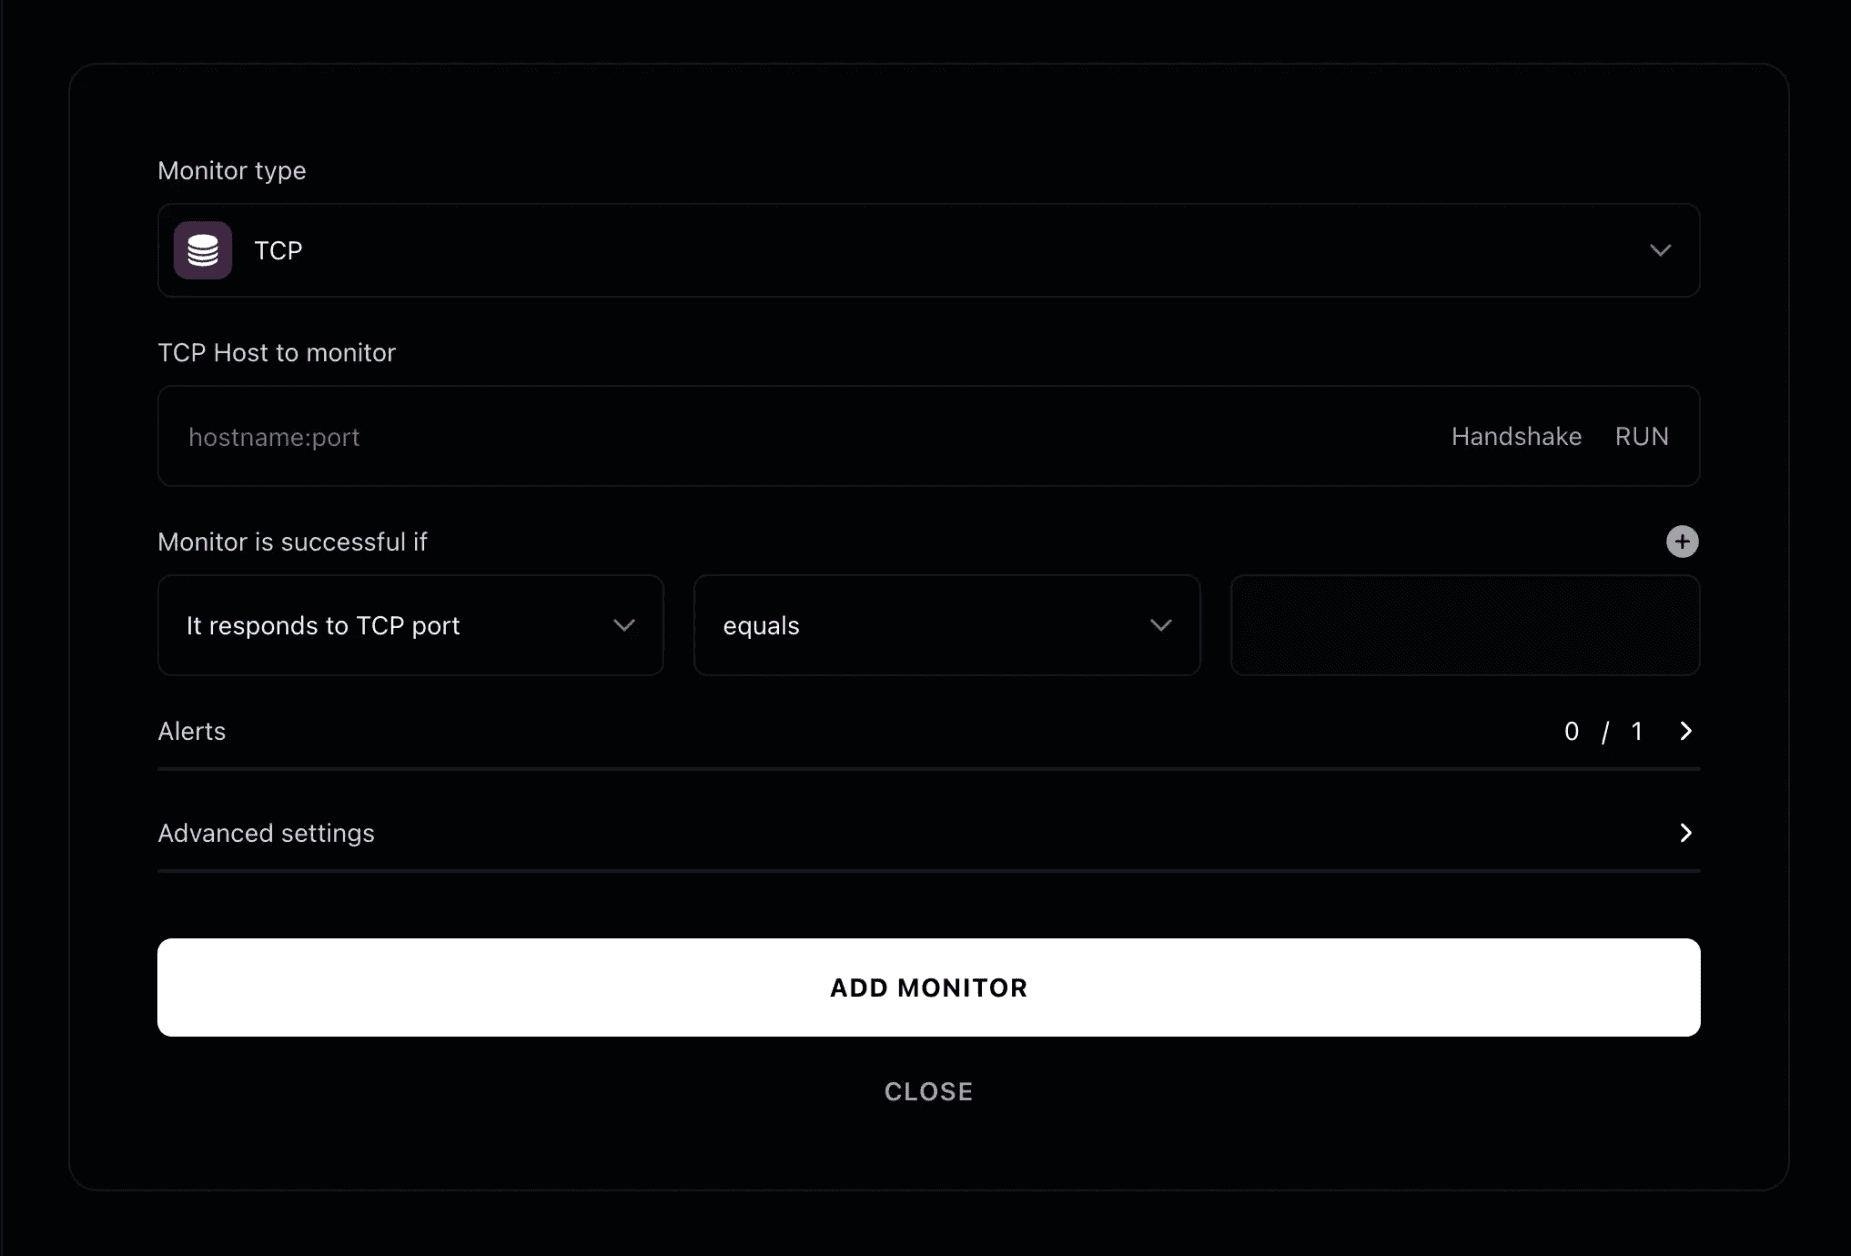
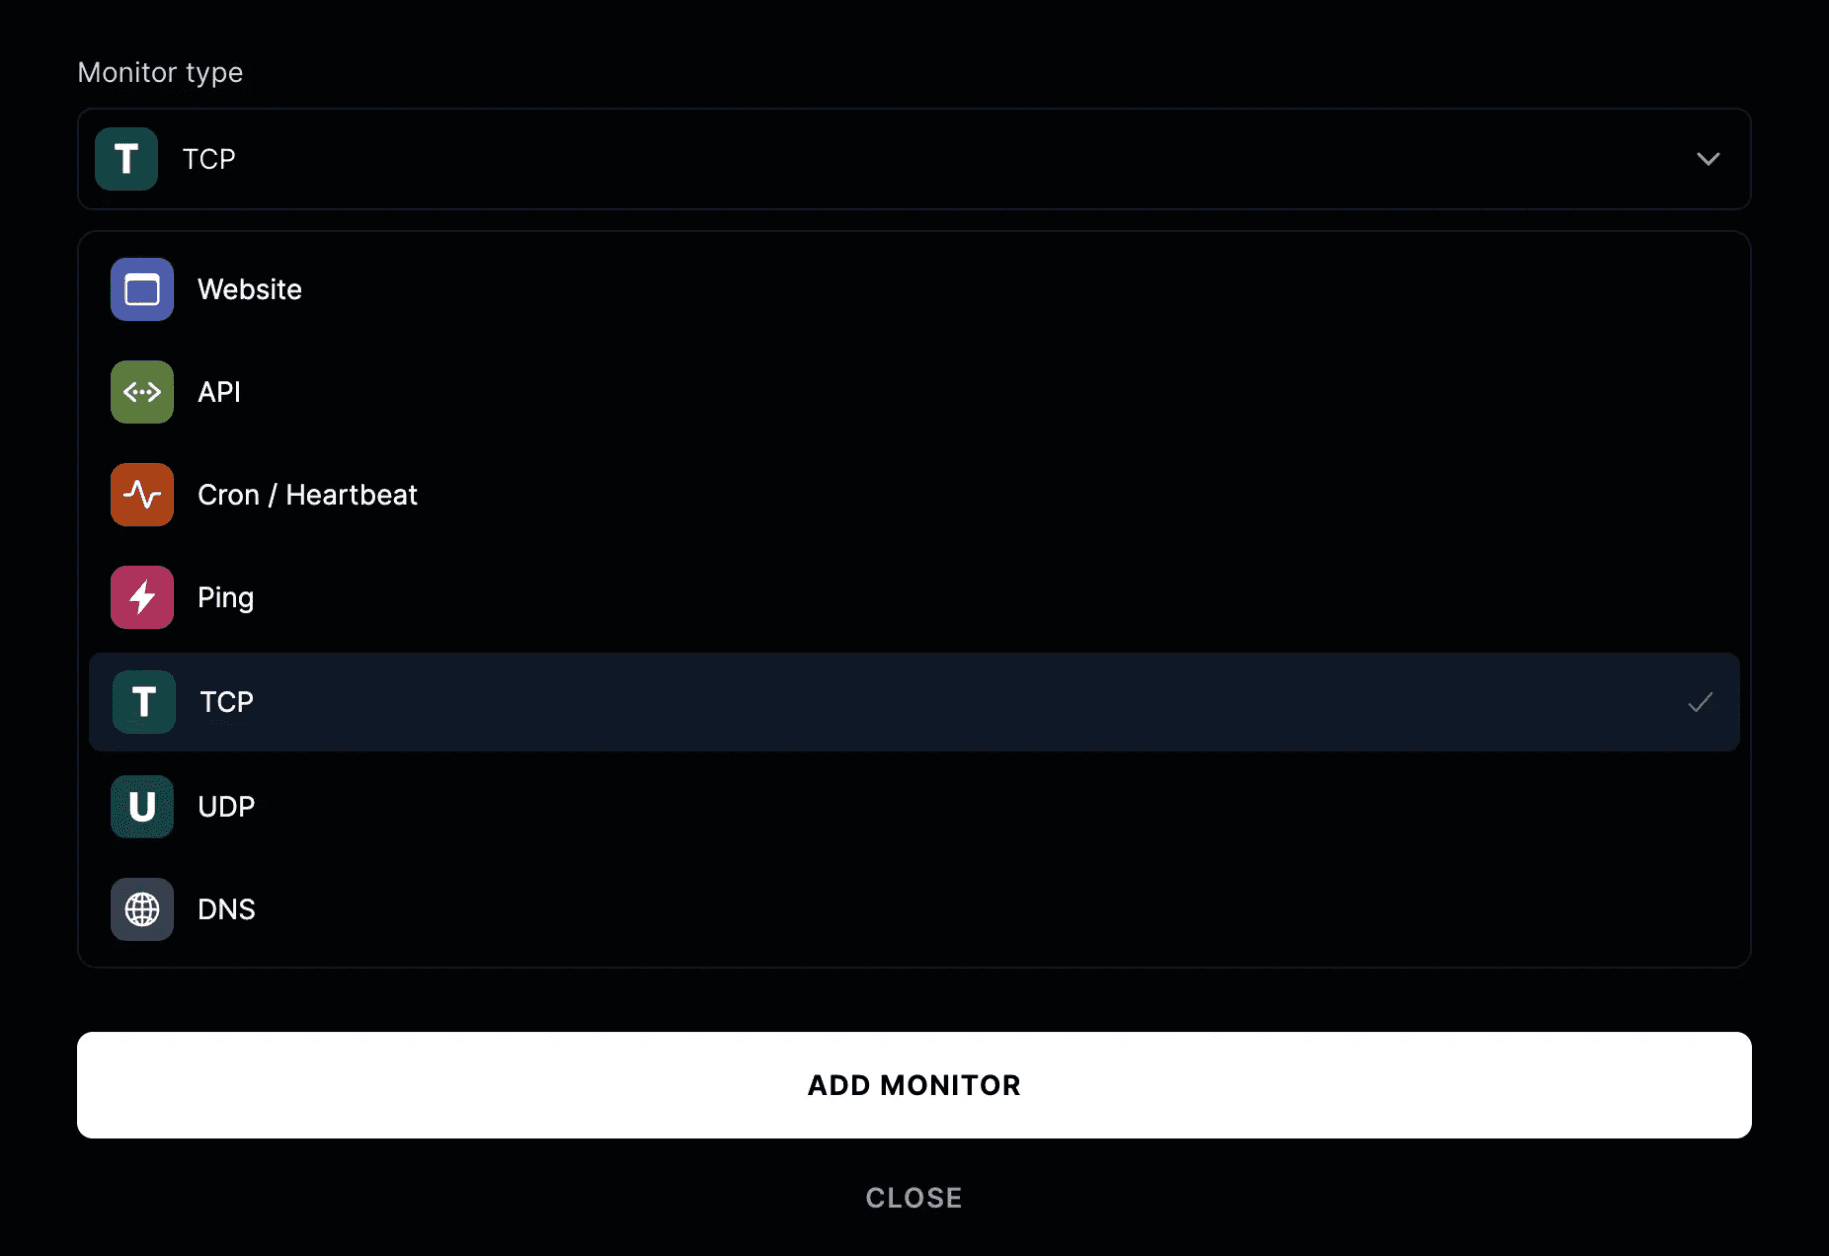
Select TCP as the monitor type.
Then enter the host and port you want to monitor, such as:
db.yourcompany.com:5432
Instatus TCP and UDP monitors verify that servers and applications are reachable over specific network ports, including databases, mail servers, application backends, DNS servers and other port-based services.
Step 2: Choose Check Frequency and Locations
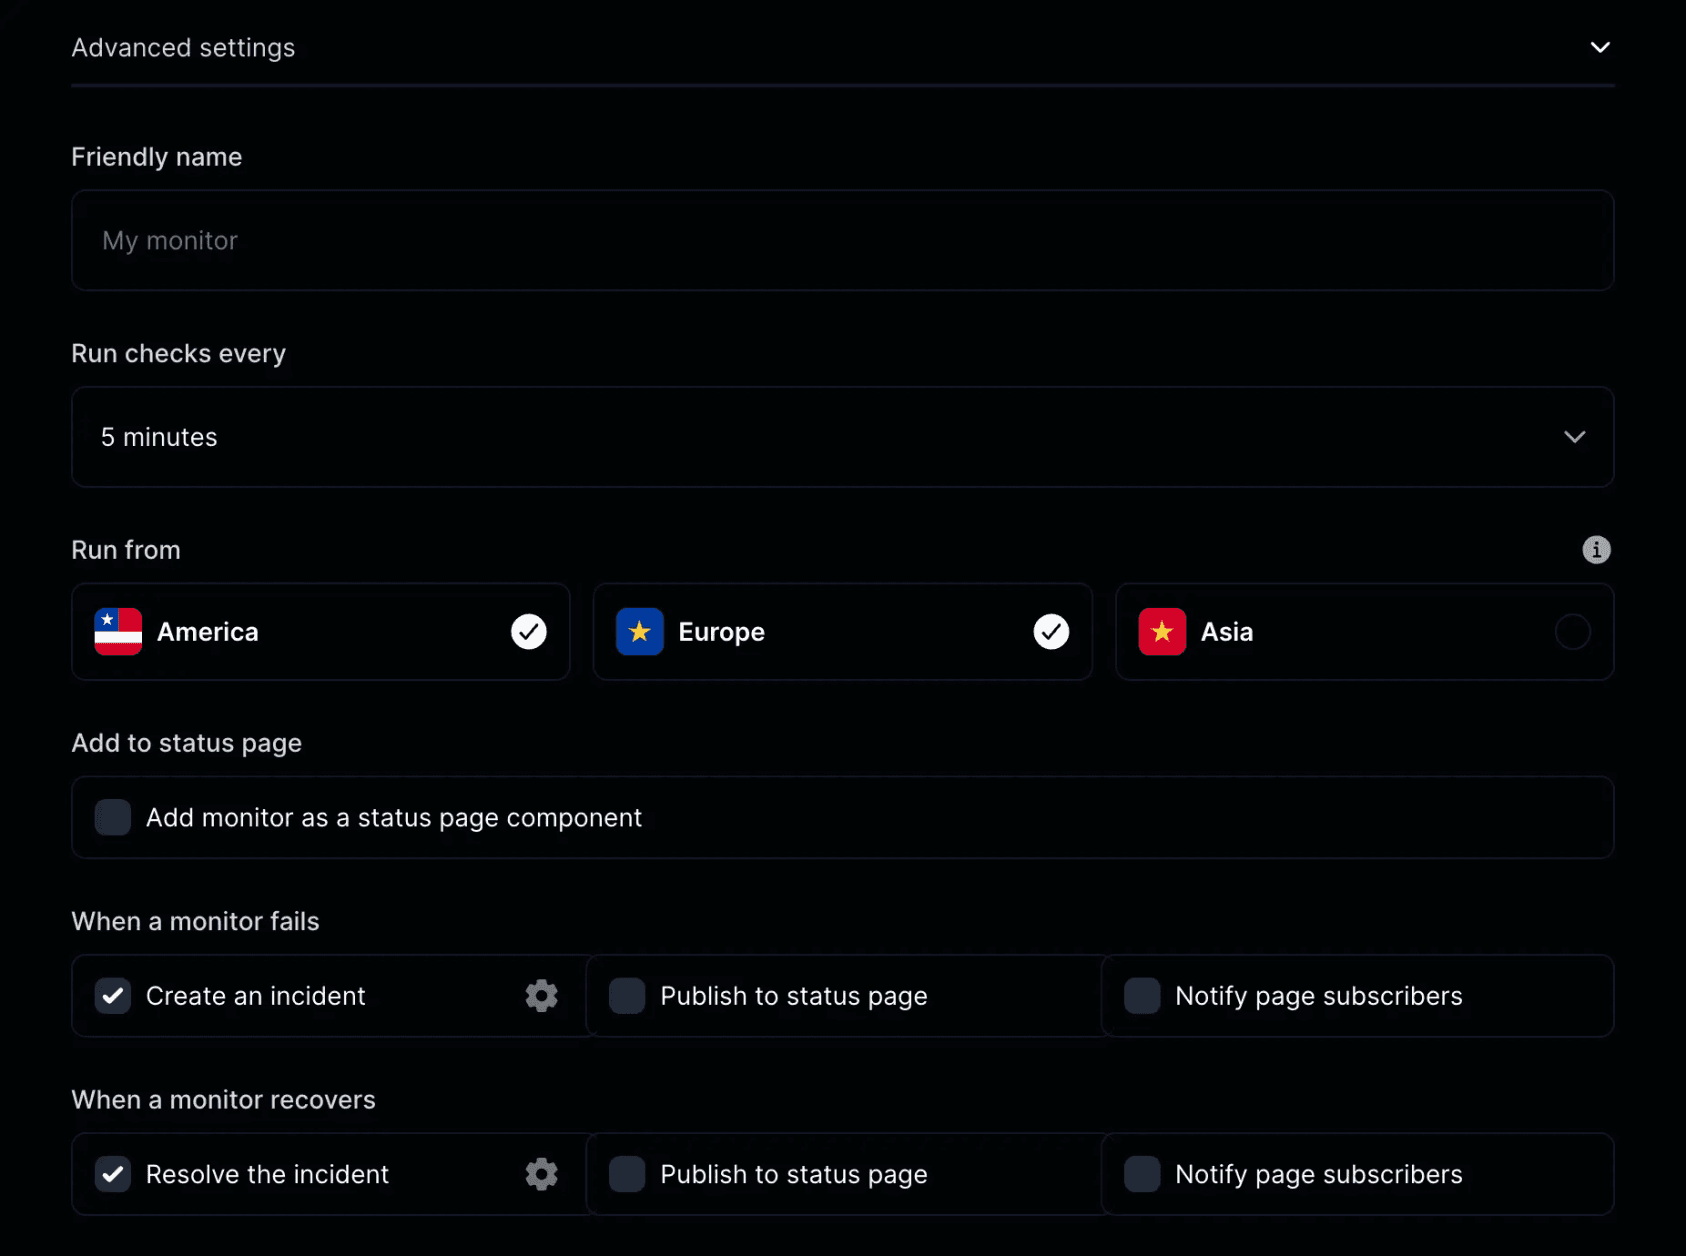
Set how often the port should be checked. Instatus monitors can check services from multiple global locations and support checks as often as every 30 seconds on paid plans.
Multi-location monitoring matters because reachability can vary by region. Running checks across selected locations helps reveal regional routing or connectivity problems that a single monitoring location may miss.
Step 3: Configure Failure and Recovery Actions
Decide what happens when a check fails. Set how many failed checks confirm an outage so a single network blip does not page anyone, and turn on recovery confirmation so the monitor reports the port as healthy only after it responds again.
Step 4: Connect the Monitor to Your Status Page
When a monitored port affects users, connect it to a status page component. That gives customers one place to see whether the issue is known, being worked on or resolved.
Instatus status pages can be public, private or select-audience, so you can share updates with everyone, only internal teams or specific customer groups.
Set Up TCP Port Monitoring Alerts
Once your TCP monitor is running, set up alert rules so the right person hears about a failed connection. Instatus lets you choose which monitors trigger an alert, where the alert goes, and when it fires.
Step 1: Choose the TCP Monitor
Select the TCP monitor or monitor group that should trigger the alert. You might separate alerts for production databases, payment ports, and internal services so each issue reaches the right team.
Step 2: Choose the Alert Channel
Pick where the alert should go. Instatus supports email, SMS, Slack, Discord, Microsoft Teams, phone calls, webhooks, and push notifications.
For critical ports, use one shared channel for visibility and one direct channel for the on-call responder.
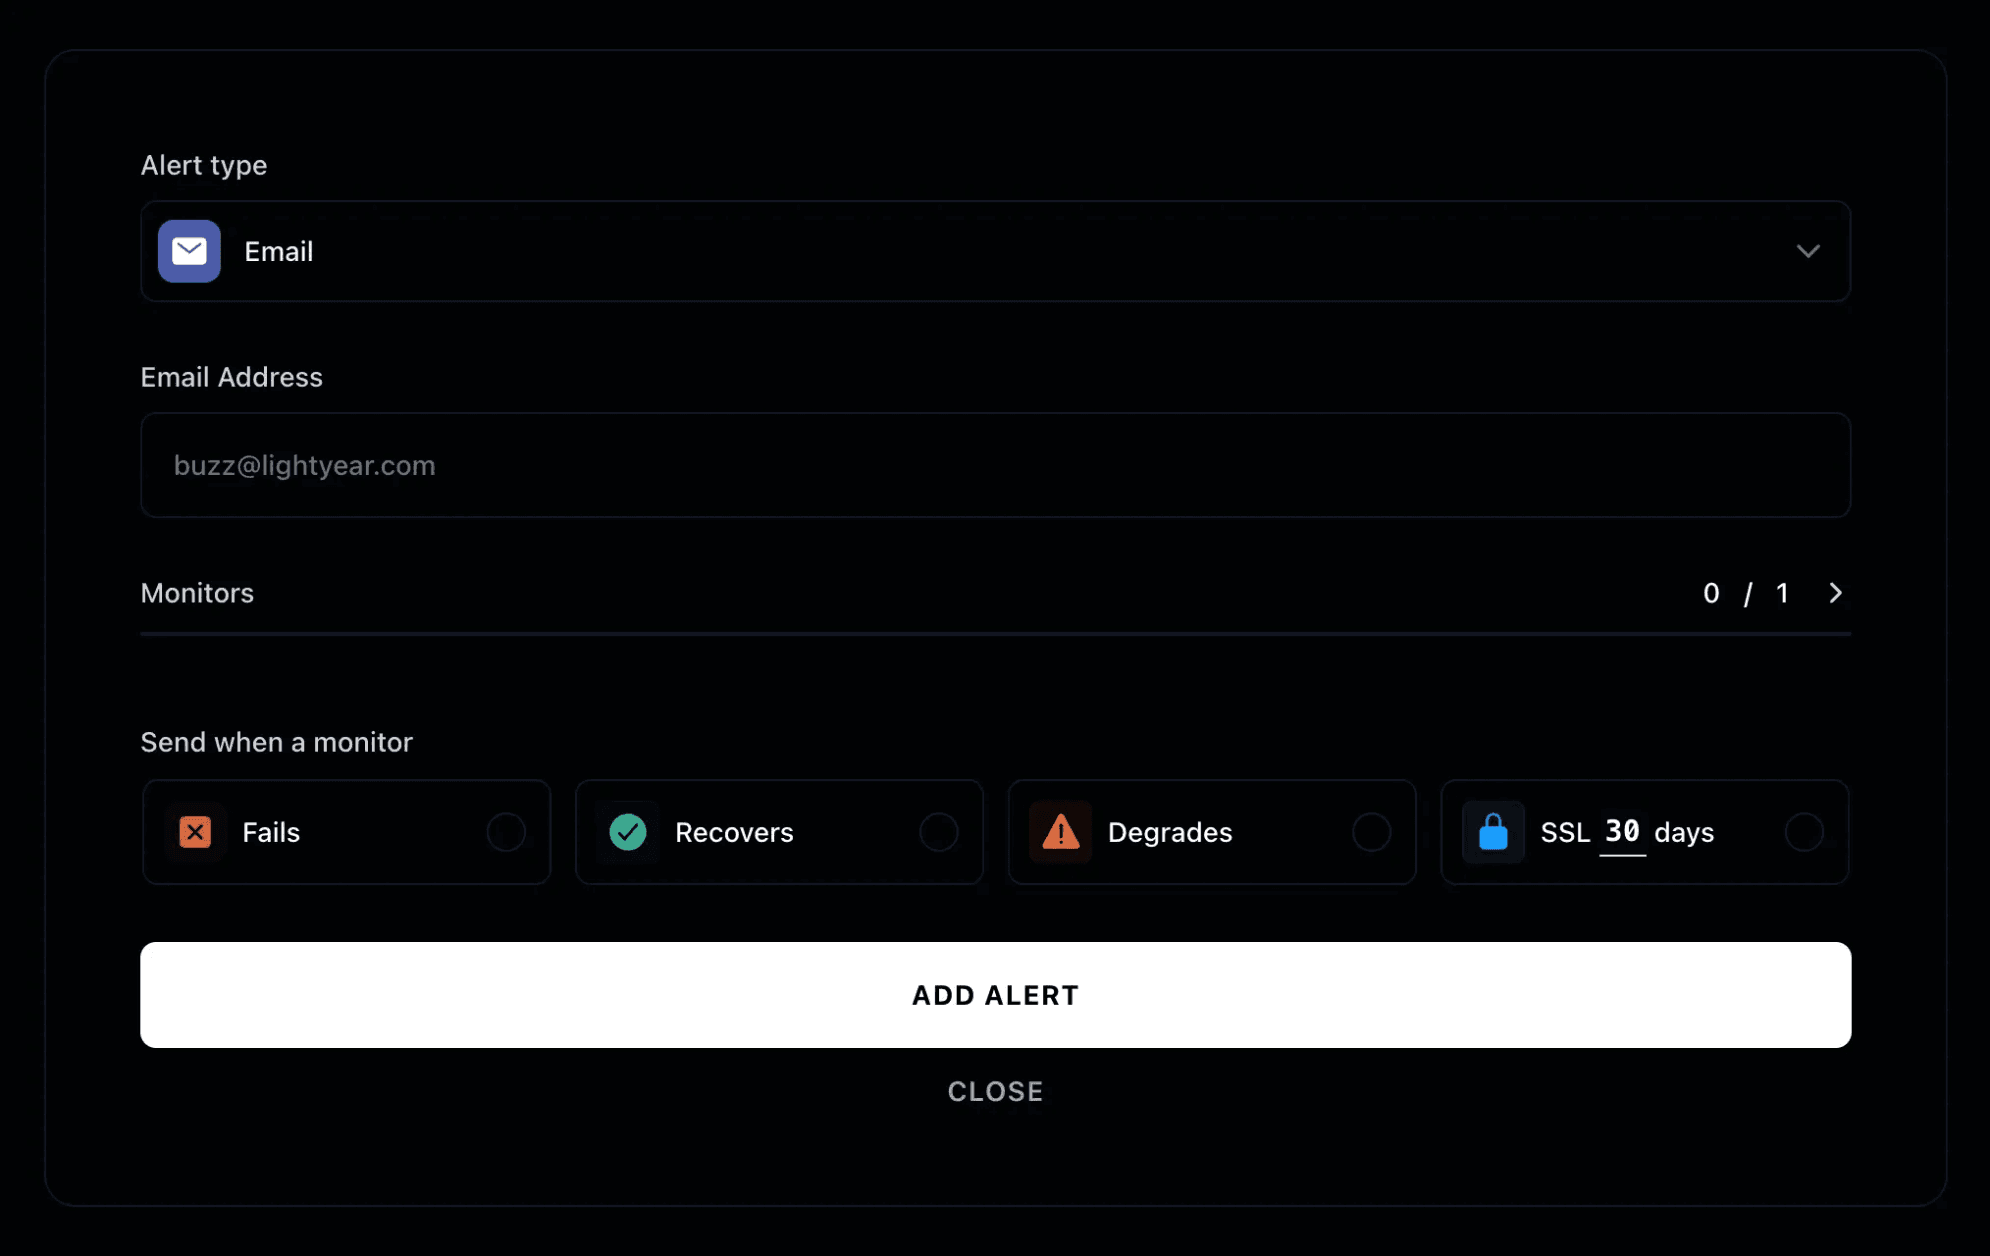
Step 3: Choose When Alerts Fire
Trigger alerts when the monitor fails, and turn on recovery alerts so the team knows when the port is reachable again. For noisier services, use degrade alerts to catch performance issues before a full outage.
Step 4: Route Critical Alerts to On-Call
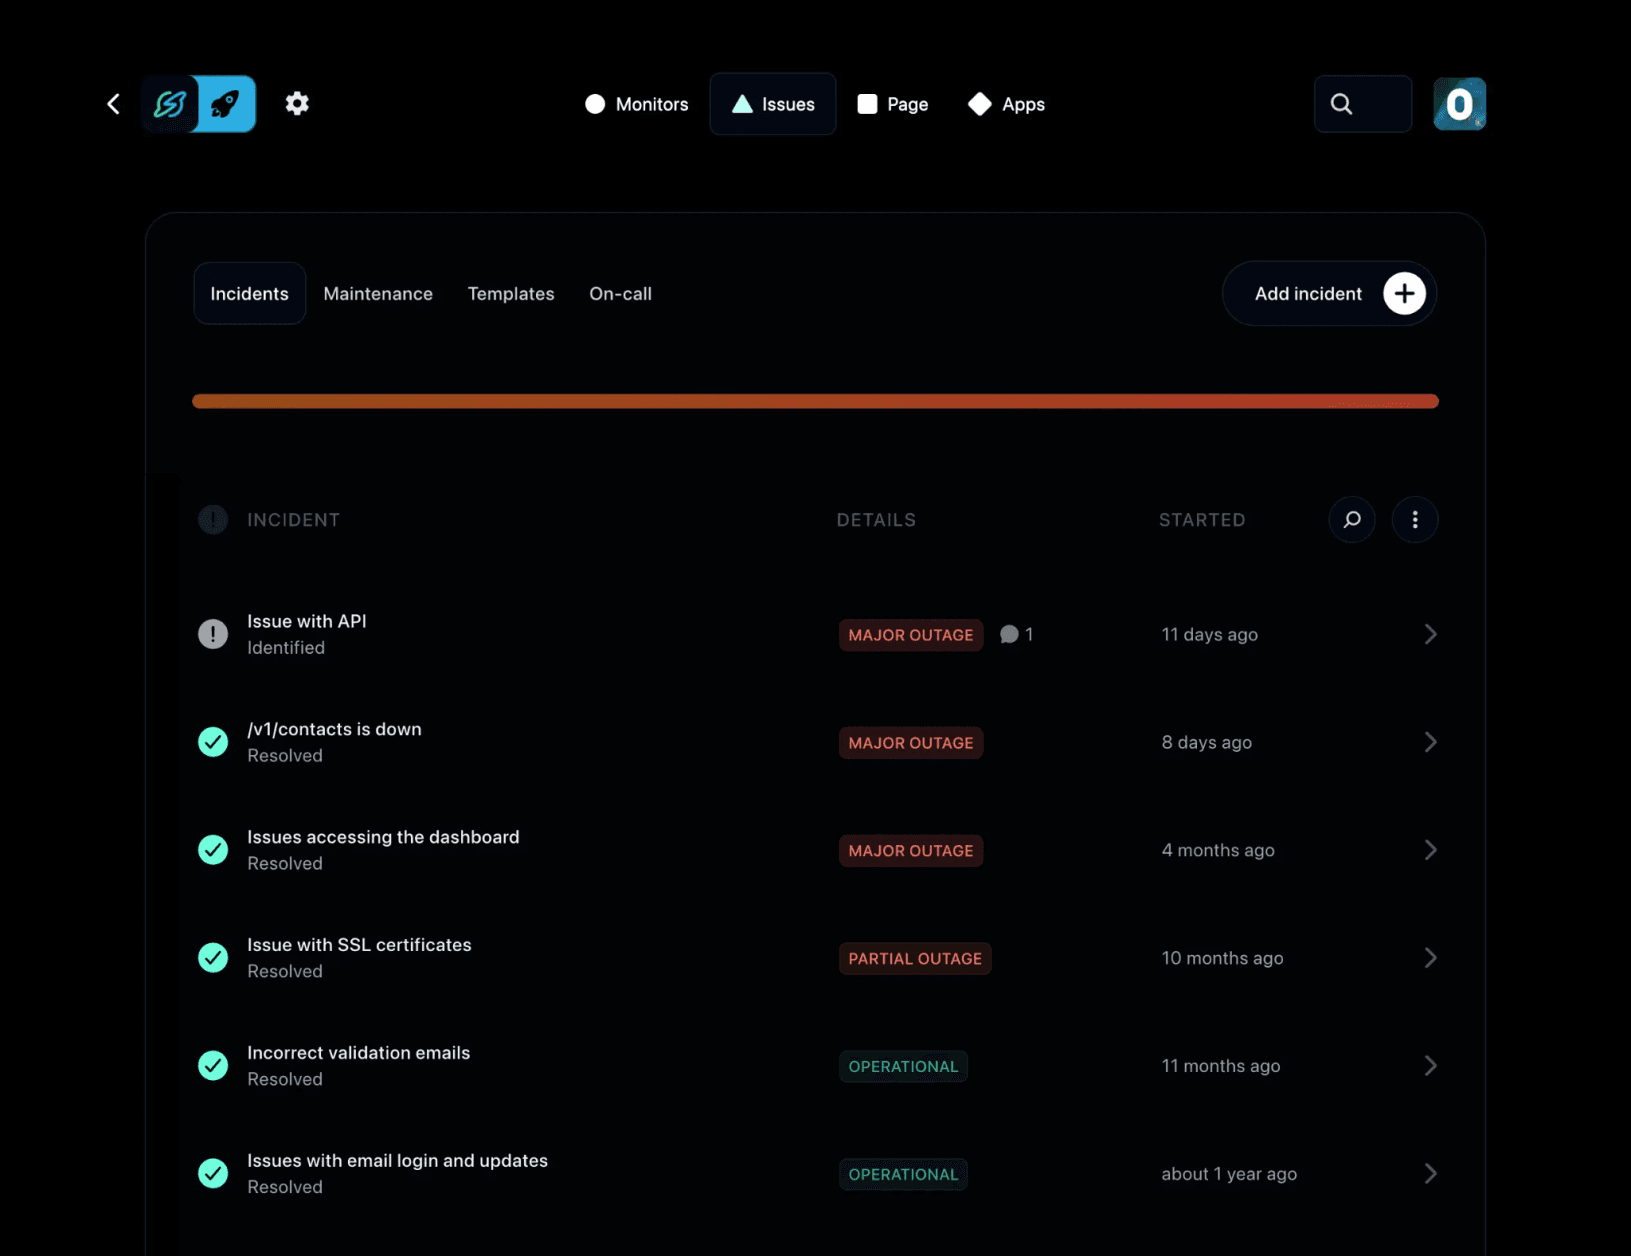
For important ports, connect alerts to your on-call process. Instatus routing rules can send incidents to the right on-call schedule or escalation policy, so the issue moves to the next responder if the first person does not acknowledge it.
TCP Port Monitoring Pricing With Instatus
Instatus includes TCP port monitoring, alerts and status pages in flat monthly plans. Yearly billing gives three months free.
See the full Instatus pricing page for current plan details.
| Plan | Monitors | Check Frequency | Key Limits |
|---|---|---|---|
| Starter, Free | 15 | 2 min | Email alerts, 5 members, 2 on-call, public page, 200 subscribers |
| Pro | 50 | 30 sec | Email/SMS alerts, 50 members, 20 on-call, 1+ custom domain, 5,000 subscribers |
| Business | 1,000 | 30 sec | SMS/call alerts, 50 on-call, SAML SSO, all page types, 3+ custom domains, 25,000 subscribers |
| Enterprise | Custom | 30 sec | SCIM sync, priority support, 99.99% uptime SLA, multiple SSO, custom contracts and policies |
Best Practices for TCP Port Monitoring
Setting up a monitor is step one. These practices keep it reliable and quiet enough to trust:
Monitor From Multiple Locations
A single check point can mislead you. A routing issue in one region can make a healthy port look down. Multiple locations help confirm whether the issue is global, regional or local.
Monitor the Ports That Matter
You do not need to monitor all 65,535 ports. Focus on the ports tied to real services and user impact.
| Port | Common Use |
|---|---|
| 22 | SSH |
| 25 | SMTP |
| 443 | HTTPS |
| 3306 | MySQL |
| 5432 | PostgreSQL |
| 6379 | Redis |
Start with the ports that power customer-facing flows, payments, authentication, databases and critical internal services.
Track Connection Time, Not Just Up or Down
A port can accept connections while taking longer than usual to establish them. Rising TCP connection time can signal network or service degradation before a complete failure.
For APIs, pair TCP checks with API monitoring so you can verify both reachability and response behavior.
Match Check Frequency to Risk
A payment or authentication port deserves faster checks than a low-risk internal service. Use shorter intervals for ports that affect revenue, login, checkout or core product workflows.
Keep Alerts Actionable
Too many alerts create noise. Too few alerts create blind spots. Route high-priority ports to on-call channels, send lower-priority alerts to team channels and review alert history often.
Knowing the difference between uptime vs availability helps you set targets that mean something.
Review Alert Data
Track how long it takes to detect and resolve port failures. If alerts fire for issues that recover on their own, tune your monitor settings. If users report issues before your alerts do, shorten the interval or add more locations.
Reviewing your DevOps metrics turns raw alerts into real reliability gains.
Monitor Your Ports Before Your Users Do
A port failure rarely announces itself. The page stays up, the dashboard looks green and the first real signal is often an unhappy customer.
Manual checks help you confirm a port on the spot. Continuous monitoring catches the failures that happen while your team is busy, offline or asleep.
Instatus gives you TCP port monitoring, multi-channel alerts and status pages in one flat-rate tool. Set up a monitor in minutes and turn silent port failures into signals your team can act on.
Start free with Instatus and monitor your ports before your users have to.
Frequently Asked Questions
What Should Happen After a TCP Monitor Fails?
Start with the alert path. Send the failure to a shared channel for visibility and a direct channel for the on-call engineer. Instatus monitor alerts support email, SMS, Slack, Discord, Microsoft Teams, phone calls, webhooks and push notifications, and on-call schedules help route the issue to the right person.
Should Internal Port Failures Go on a Public Status Page?
Not always. If the port affects customers, add it to a customer-facing status page. If it only affects internal teams, use a private status page or select-audience status page so the right people see the update without confusing everyone else.
When Should I Use TCP Monitoring Instead of API Monitoring?
Use TCP and UDP monitoring when you only need to confirm that a service is reachable on a specific port. Use API monitoring when you need to validate status codes, response times, headers, JSON bodies or response payloads.
How Should I Monitor Services Behind a Firewall?
The monitor still needs a path to the port. For private services, allow the monitoring traffic through your firewall or run checks from a network location that can reach the service. Use the same logic for private APIs, databases or DNS services that are not exposed to the public internet. Instatus TCP and UDP monitors are built for services that listen on specific network ports.
What Other Checks Should I Pair With TCP Port Monitoring?
Pair TCP checks with the monitors that match the user journey. Use DNS monitoring to catch resolution issues, API monitoring to validate endpoint behavior and ping monitoring to check basic network reachability.
How Do I Show Port Reliability to Customers?
Use a status page to show current status, incidents and planned maintenance. You can also add metrics and charts to your page when you want to share reliability data in a clearer way.

Get ready for downtime
Monitor your services
Fix incidents with your team
Share your status with customers