

We Reviewed the Best Port Monitoring Tools for DevOps and SRE Teams

Quick Summary
This guide reviews the best port monitoring tools for DevOps, SRE, and engineering teams that need to check TCP and UDP services, get alerts, manage incidents, and keep customers updated.
Our top picks:
- Instatus: Best for SaaS teams combining monitoring, on-call, and status pages.
- UptimeRobot: Best for simple and affordable port checks.
- ManageEngine Applications Manager: Best for port checks inside broader APM workflows.
For more guides like this, visit the Instatus blog.
Which Port Monitoring Tool Fits Your Incident Workflow?
A server can be "up" while the service your users need is down. Ping may pass, but PostgreSQL on 5432, SMTP on 587, or DNS on 53 may still refuse connections. A port monitoring tool checks whether a specific service is reachable from outside your infrastructure.
In this Instatus guide, we'll compare the best port monitoring tools for DevOps and SRE teams, including how they handle checks, alerts, incident response, status pages, and reliability workflows.
Why Listen to Us?
At Instatus, we help teams monitor services, respond to incidents, and keep users updated when something breaks. Teams like Wistia, Deno, Adalo, Podium, Restream, Airbyte, Harvard, and Modern Treasury use Instatus status pages, and this has earned us a 4.9 rating on G2 and 4.8 on Capterra. These give us a clear view of what teams need when a service breaks, the first alert, the updates in between, and a clean recovery.
What is a Port Monitoring Tool?
A port monitoring tool checks whether a specific host and port are reachable at regular intervals. TCP checks confirm whether a connection can be opened, while UDP checks send packets and wait for a valid response.
For example, a port monitoring tool can confirm whether your API is accepting traffic on port 443, PostgreSQL is reachable on port 5432, or DNS is responding on port 53.
This makes port monitoring useful when the service behind the port matters more than the host itself.
Port Monitoring vs Ping, API, and Switch-Port Monitoring
Port monitoring is different from related checks like ping monitoring, API monitoring, and switch port monitoring:
- Ping monitoring tells you whether a host responds, but not whether the service your users need is working.
- API monitoring goes deeper by validating status codes, response bodies, headers, and response time. Check our API monitoring guide for a detailed breakdown.
- Switch port monitoring is different again. It tracks physical network interfaces, traffic, bandwidth, and SNMP data, which is more relevant to network administration than DevOps service reliability.
Top 7 Port Monitoring Tools to Choose From
Before we break down each platform, here's a quick side-by-side view of the best port monitoring tools by fit, port coverage, and starting price.
| Tool | Best For | Port Coverage | Pricing |
|---|---|---|---|
| Instatus | SaaS and DevOps teams that need monitoring, alerts, on-call, incidents, and status pages | TCP, UDP, website, API, ping, DNS | Free plan. Pro starts at $20/month. Business starts at $300/month. |
| UptimeRobot | Teams that need simple, affordable port checks | TCP, UDP, HTTP, ping, DNS, SSL | Free plan. Paid plans start at $8/month. |
| Site24x7 | Teams that need global checks and deeper diagnostics | TCP/IP service monitoring | 30-day free trial. Paid plans start at $10/month. |
| Dotcom-Monitor | Teams that need TCP/Telnet checks from global locations | TCP and TCP connection monitoring | Free plan. Paid plans start at $19.99/month. |
| ManageEngine Applications Manager | Teams that want port checks inside broader APM | TCP and UDP service monitoring | Free edition. Paid plans start at $395/year. |
| Pulsetic | Teams that want simple port monitoring and status pages | Port, TCP, ICMP, SSL monitoring | Free plan. Paid plans start at $9/month. |
| Pinghome | Teams that need customizable TCP/UDP checks and mobile alerts | TCP and UDP port monitoring | Paid plans start at $12/month. |
1. Instatus
Instatus is an uptime monitoring, incident management, on-call, and status page platform for teams that need to detect service issues and communicate clearly.
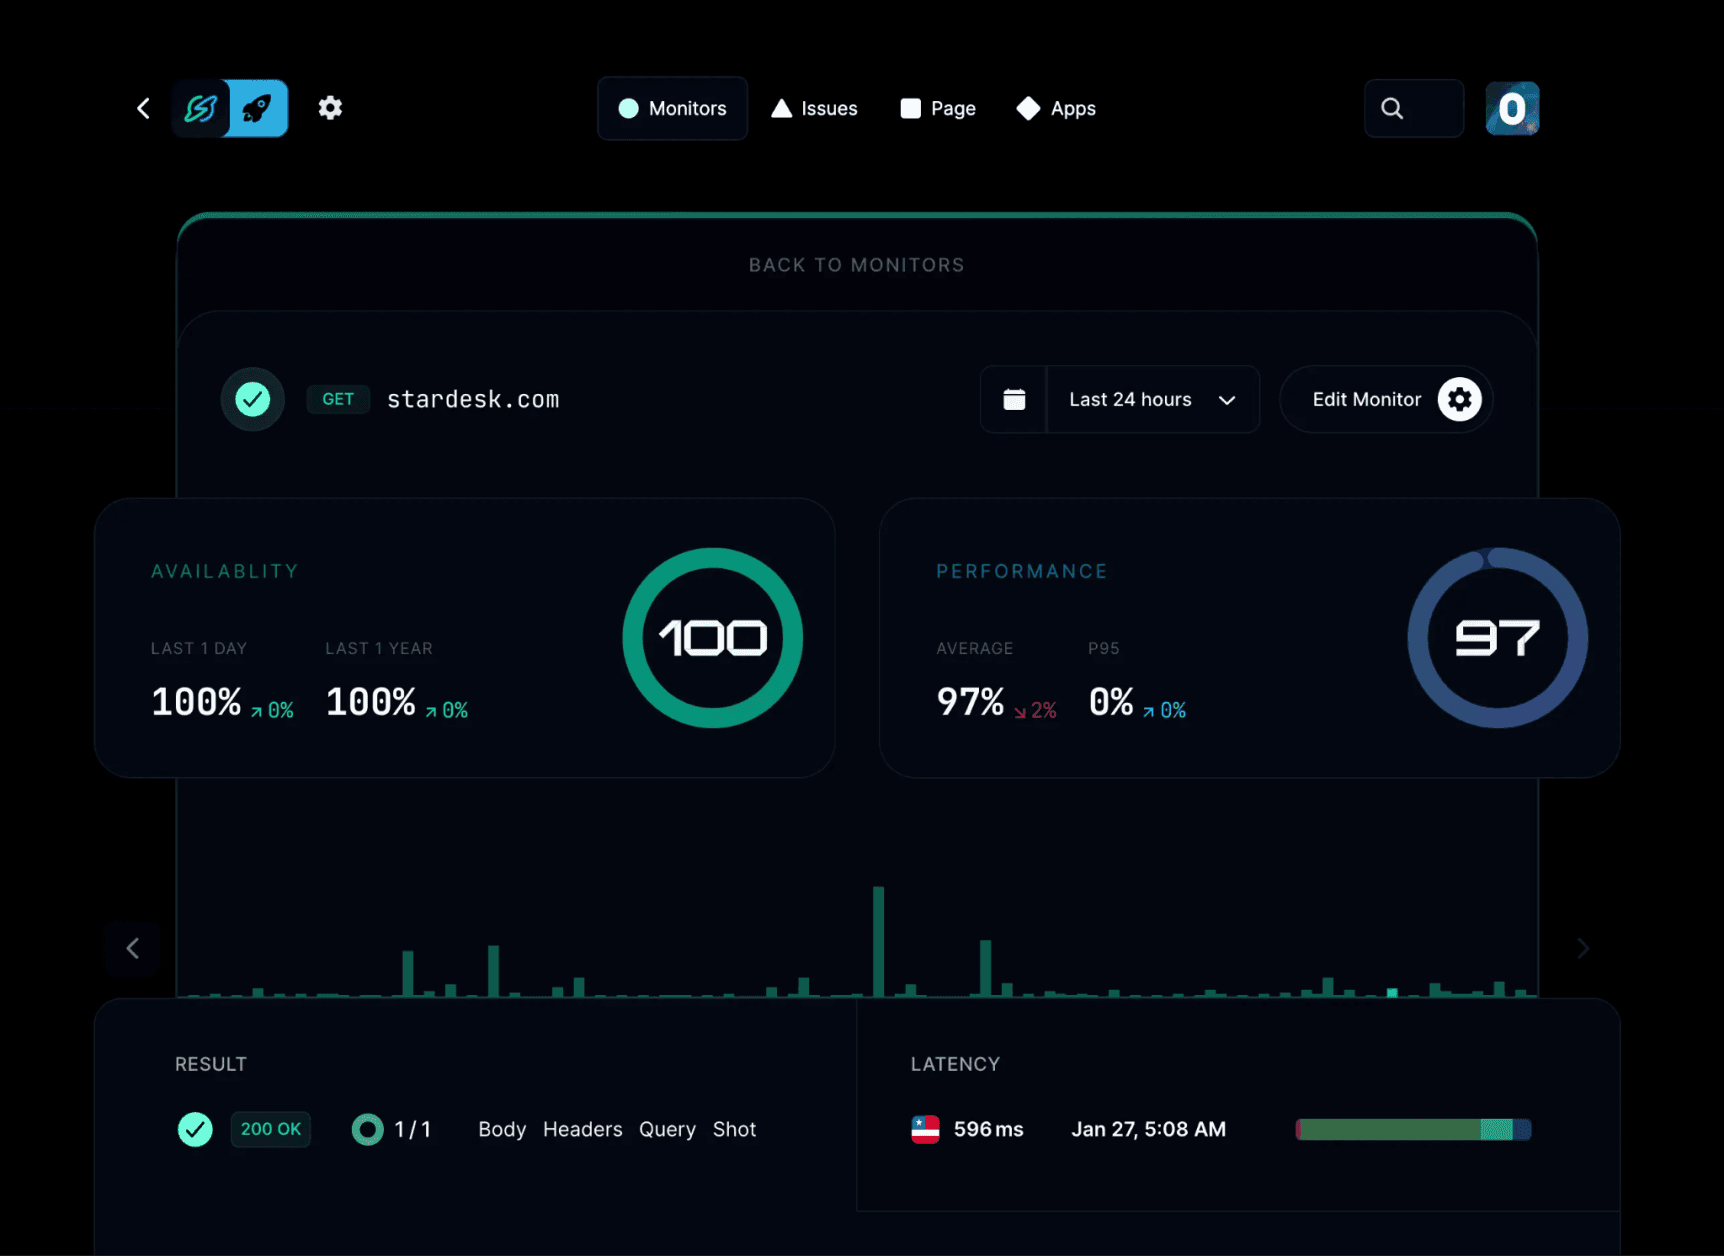
As a port monitoring tool, it supports TCP and UDP checks, so teams can verify whether important services are reachable on the ports they depend on. That can include APIs, databases, DNS, mail servers, internal services, and other infrastructure endpoints.
Where Instatus stands out is that monitoring does not stop at detection. Teams can run checks as often as every 30 seconds, monitor from multiple regions, define success conditions, and receive alerts through Slack, email, SMS, phone calls, and more.
When a monitor fails, Instatus can route the alert to the right responder, create an incident, publish updates to a status page, and notify subscribers. When the service recovers, we can resolve the incident and update customers automatically.
Key Features
- TCP and UDP Monitoring: Check whether important services are reachable on the ports they use.
- Multiple Monitor Types: Monitor websites, APIs, ping, TCP, UDP, and DNS from one platform.
- Frequent Regional Checks: Run checks as often as every 30 seconds from locations across the United States, Canada, Europe, and Asia.
- Custom Success Conditions: Define conditions based on availability, status codes, response time, keywords, headers, JSON body, DNS responses, and TCP port thresholds.
- Detailed Logs: Keep logs of response bodies, headers, and related monitor details for troubleshooting.
- Multi-Channel Alerts: Notify teams through Slack, email, SMS, phone calls, and more.
- On-call Scheduling: Route failed monitors to the right person based on your on-call schedule when human response is needed.
- Status Page Integration: Create or resolve incidents, publish updates, and notify subscribers when monitored services fail or recover.
Pricing
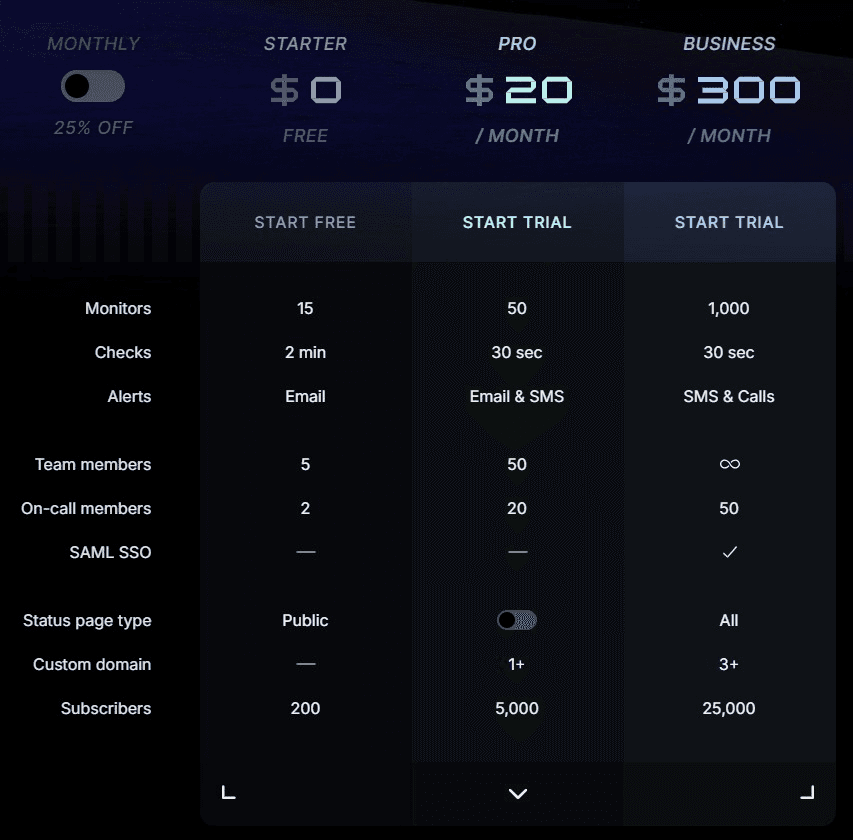
Instatus uses flat monthly plans:
- Starter: Free, with 15 monitors, email alerts, 5 team members, 2 on-call members, and 200 subscribers.
- Pro: $20/month, with 50 monitors, 30-second checks, SMS alerts, 20 on-call members, and 5,000 subscribers.
- Business: $300/month, with 1,000 monitors, calls, SAML SSO, all status page types, and 25,000 subscribers.
- Enterprise: Custom plan with advanced security and support.
Pros
- Connects monitoring to customer-facing incident communication
- Flat-rate plans make monthly budgeting easier
- Strong fit for SaaS incident response workflows
- Native uptime monitoring reduces tool sprawl quickly
Cons
- Not a standalone port-monitoring tool
2. UptimeRobot
UptimeRobot is an uptime monitoring platform that helps teams check whether websites, APIs, servers, cron jobs, DNS, and ports are available.
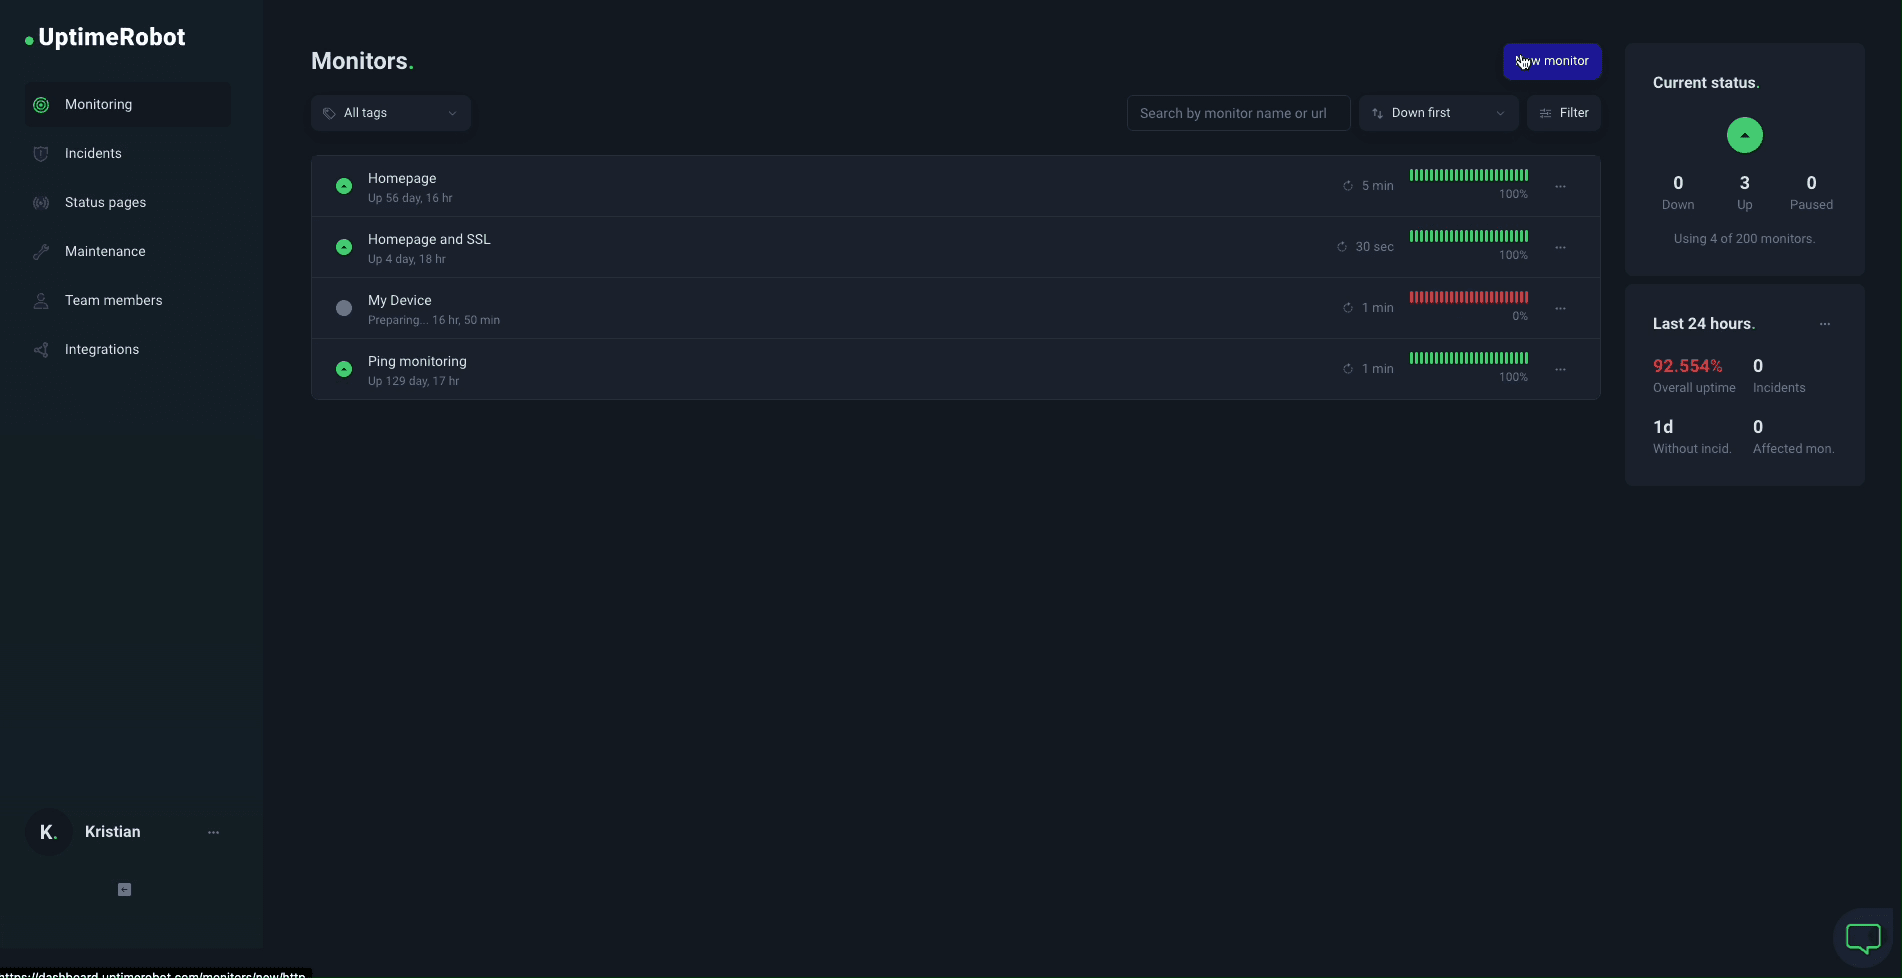
For port monitoring, it is especially useful when you need a fast way to confirm that specific services are reachable on the ports they depend on, including HTTPS, SSH, FTP, SMTP, MySQL, PostgreSQL, DNS, and custom TCP ports.
Key Features
- TCP Port Monitoring: Monitor any TCP port, including standard and custom service ports.
- Email Service Checks: Monitor POP3, IMAP, and SMTP ports.
- DNS Port Monitoring: Check whether DNS connections are available.
- Multi-Location Checks: Test availability from selected regions.
- Response Time Tracking: See more than basic up/down status.
- Alerts: Notify teams by email, SMS, voice call, Slack, Zapier, Splunk, and other integrations.
- Status Pages: Share uptime and incidents publicly.
Pricing
UptimeRobot has a free plan with 50 monitors and five-minute checks. Monthly pricing for the starting monitor tiers includes:
- Solo at $8/month, with up to 10 monitors
- Team at $34/month, with up to 100 monitors
- Enterprise at $64/month, with up to 200 monitors
Annual billing lowers the equivalent monthly rates to $7 for Solo, $29 for Team, and $54 for Enterprise. Higher-priced tiers are available when you need more monitors.
Pros
- Very fast setup for basic availability checks
- Good fit for simple port checks
- Familiar tool for many software teams
Cons
- Incident workflows are comparatively lightweight
- TCP focus limits UDP use cases
- Status communication can feel basic
3. Site24x7
Site24x7 is built for teams that care about more than whether a port is simply open or closed. Its port monitoring can check services across TCP/IP ports from more than 130 global locations, track response performance, and provide diagnostics like DNS time and response time splits.
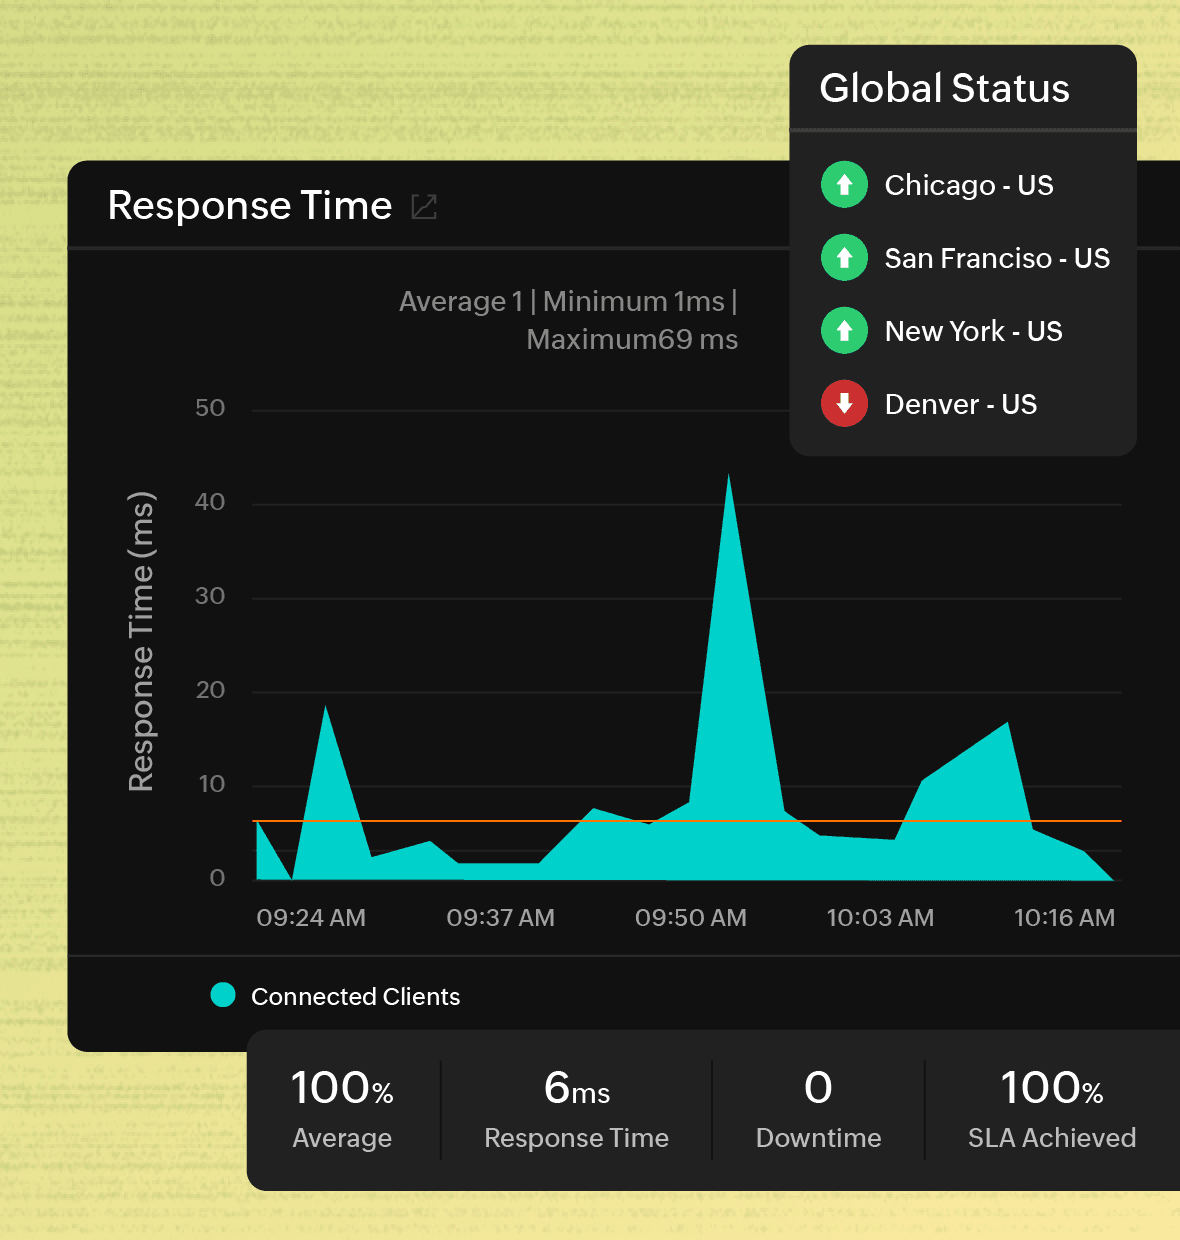
This makes it useful for teams managing business-critical services such as HTTPS, SMTP, IMAP, SSH, Cassandra, and other port-based systems.
Key Features
- Global Port Monitoring: Monitor ports from 130+ locations at preferred check frequencies.
- Service Coverage: Track 20+ services, including HTTPS, IMAP, SMTP, SSH, and Cassandra.
- Custom Commands: Run service-based commands through ports to validate functionality.
- Security Visibility: Get notified when ports are unexpectedly open.
- Diagnostics: View response time splits, DNS time, reports, dashboards, and root cause analysis.
- Alerts: Send notifications by email, SMS, calls, Slack, Jira, or PagerDuty.
Pricing
Site24x7 offers a 30-day free trial. Paid plans include:
- Lite starts at $10/month, with 2 servers and 5 websites.
- Professional costs $49/month, with 20 websites, 5 servers, log ingestion, and network monitoring.
- Enterprise starts at $625/month (paid annually) for larger monitoring needs.
Add-ons for more basic, host, advanced monitors, as well as network components, logs, and RUM page views are also available.
Pros
- Broad coverage across IT environments
- Strong fit for enterprise monitoring
- Useful service templates reduce setup
Cons
- Interface can feel crowded quickly
- Add-ons affect total monitoring cost
- Simple port checks may feel overbuilt
4. Dotcom-Monitor
Dotcom-Monitor is focused on verifying whether ports are listening, accepting connections, and reachable from different regions. It is a practical choice for teams that want visibility into TCP/Telnet connectivity across servers, applications, and network services, especially when global availability matters.
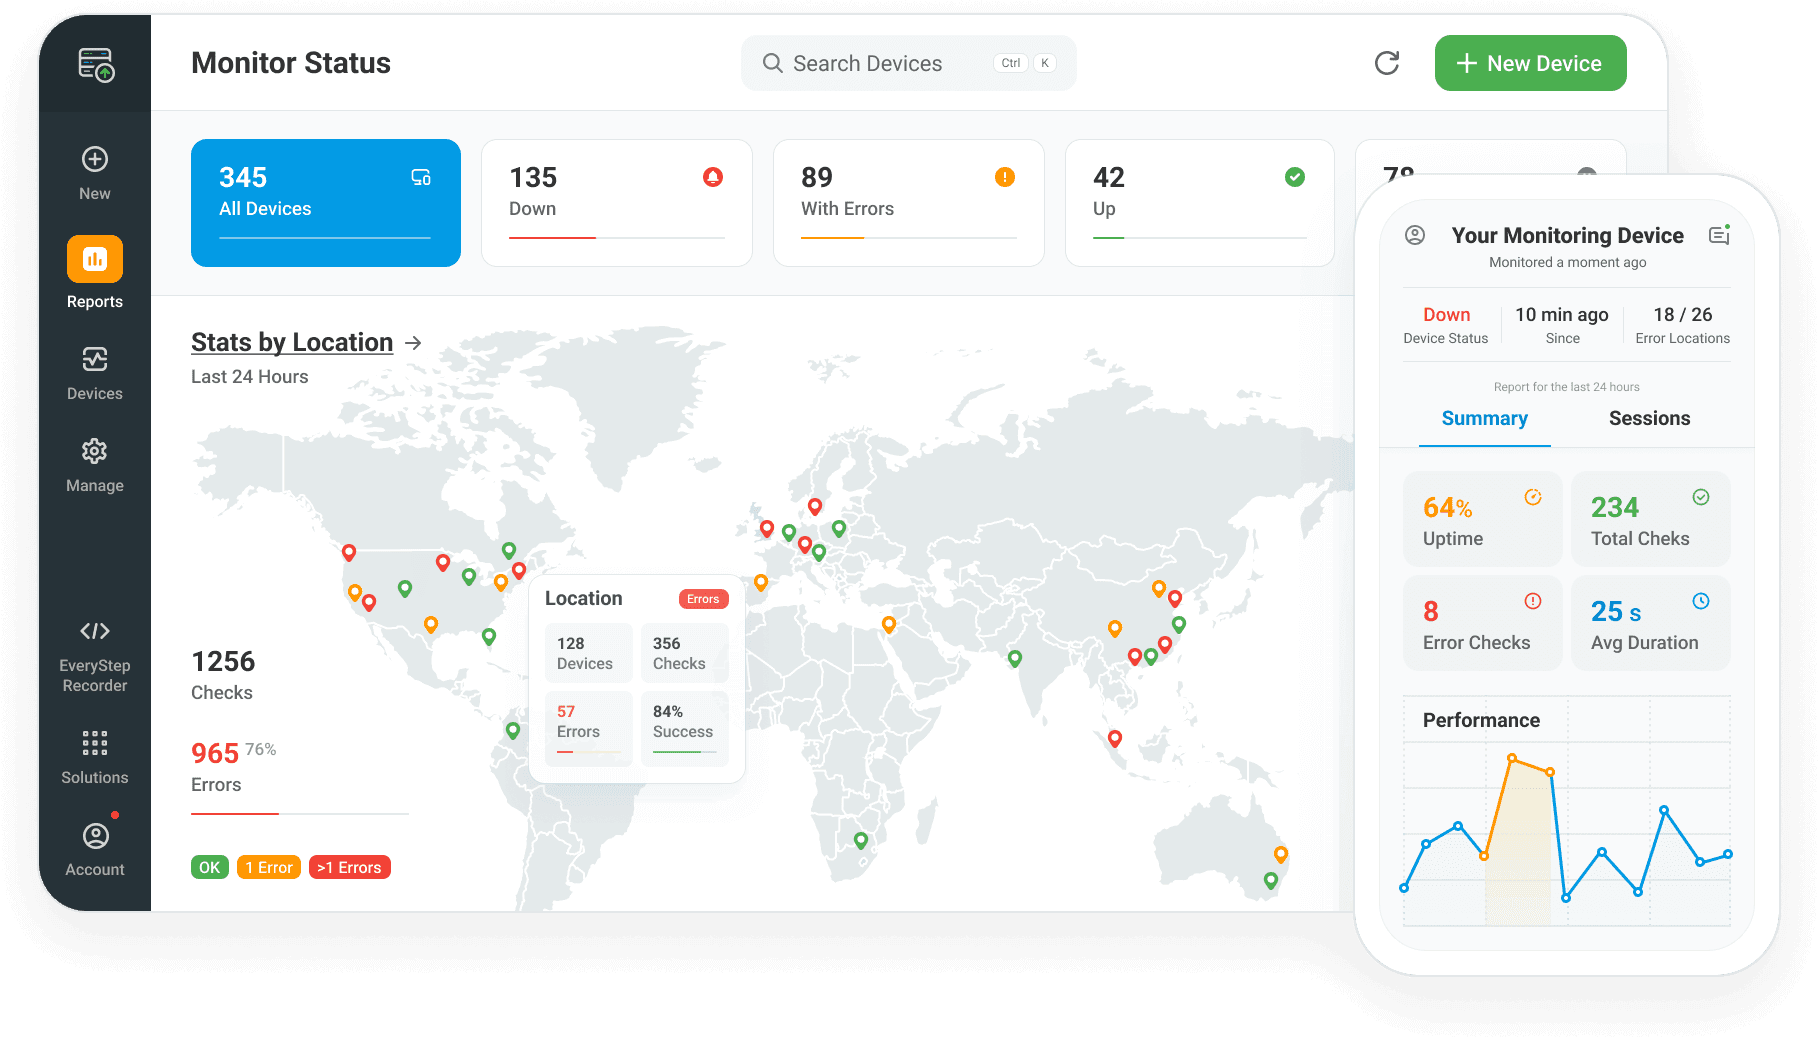
Its diagnostic features also make it useful for troubleshooting connection failures, spotting origin-related issues, and understanding traffic flow between clients and servers.
Key Features
- TCP Port Monitoring: Check whether devices are accepting connections on specified TCP ports.
- Telnet-Style Checks: Attempt TCP connections to confirm whether remote services are reachable.
- Global Monitoring: Test port availability from worldwide monitoring locations.
- Multiple Port Monitoring: Monitor several ports at once for broader network visibility.
- Diagnostics: Get detailed information when connectivity issues occur.
- Alerts: Receive notifications by email, SMS, SNMP consoles, and more.
Pricing
- Dotcom-Monitor has a Free Forever plan with 25 targets, 5-minute checks, 2 global locations, 7-day retention, email alerts, dashboards, and mobile app access.
- Paid subscriptions start at $19.99/month with 100 targets, 1-minute checks, 25 locations, one-year retention, integrations, private agents, and API access.
- Customizable Enterprise Plan is also available.
Pros
- Solid for external TCP validation
- Good global monitoring location coverage
- Flexible for private monitoring needs
- Free-forever plan is great for small teams
Cons
- Pricing scales with monitoring volume
- Interface suits technical operations users
- Incident collaboration is an afterthought
5. ManageEngine Applications Manager
ManageEngine Applications Manager is useful when port checks need to be tied to service health, response-time thresholds, reporting, and automated remediation.
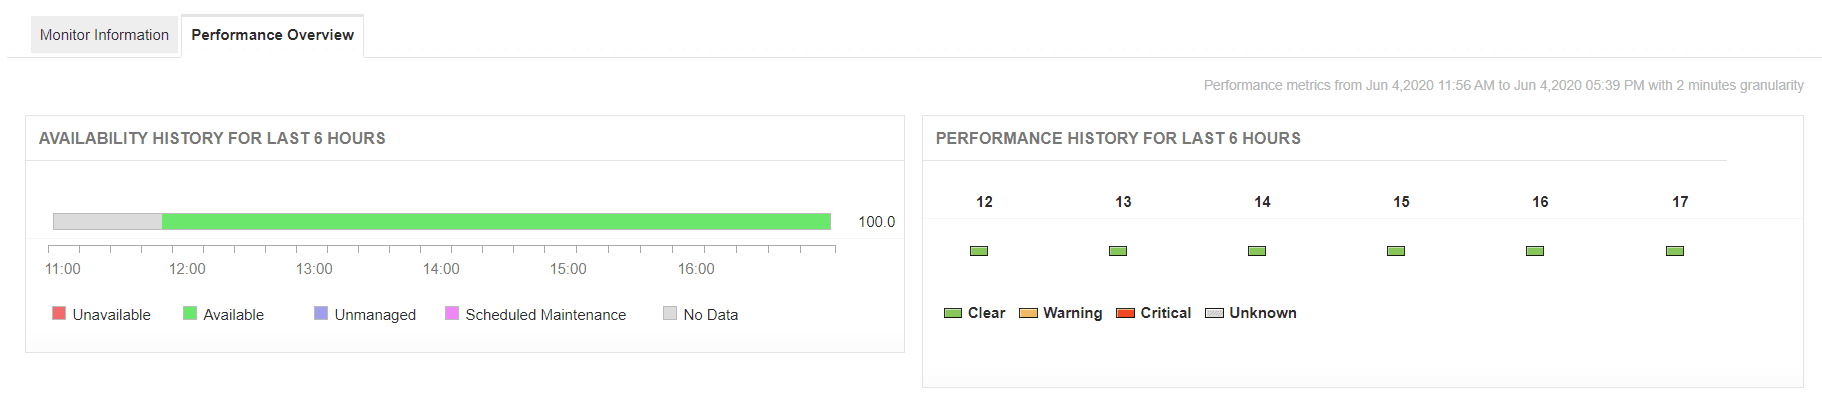
It monitors services running on TCP and UDP ports, tracks availability and response time, and helps teams spot degradation before it becomes a major outage. This makes it a strong fit for teams managing application services, network ports, and infrastructure dependencies from one monitoring console.
Key Features
- TCP Port Monitoring: Monitor services running on TCP ports such as FTP, Telnet, and other TCP/IP services.
- UDP Port Monitoring: Track application services running on UDP ports in real time.
- Response Time Tracking: Detects slow services and threshold violations.
- Alerts and Escalation: Notify teams through email, SMS, and automated event escalation.
- Automated Remediation: Run scripts to start or restart services when issues occur.
- Reports: Track downtime, availability, health, historical response times, and forecast trends.
Pricing
ManageEngine Applications Manager has a free edition for up to 5 apps or servers, and two paid annual subscriptions:
- Professional starts at $395/year with 10 monitors and 1 user.
- Enterprise starts at $3,995/year for 100 monitors and 1 user.
Perpetual licenses, extra users, and add-ons are available separately.
Pros
- Corrective scripts support practical remediation
- Good for enterprise application teams
- Fits broader APM use cases
Cons
- Not ideal for lightweight SaaS monitoring
- Requires planning around monitor counts
- Interface depth can slow first setup
6. Pulsetic
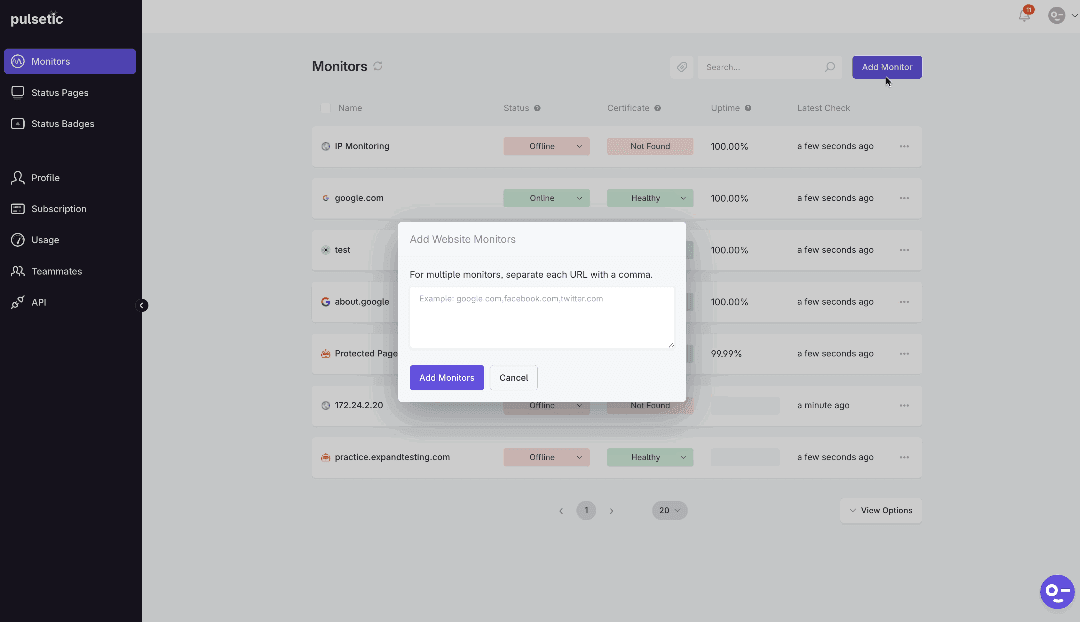
Pulsetic is built for teams that want port monitoring without a complex setup. It helps monitor critical services across HTTPS, FTP, DNS, SSH, POP3, IMAP, and SMTP, with support for IPv4 and IPv6.
Its biggest strength is simplicity. Teams can add ports quickly, run frequent checks, and get notified before downtime affects customers or internal operations.
Key Features
- Port Monitoring: Track open ports and detect when services go offline.
- Service Coverage: Monitor HTTPS, FTP, DNS, SSH, POP3, IMAP, and SMTP.
- Frequent Checks: Run connectivity checks as often as every 30 seconds.
- Response Times: Use response-time data to investigate downtime faster.
- Alerts: Notify teams through Slack, Microsoft Teams, Discord, Zapier, webhooks, API, SMS, or voice calls.
- Team Access: Manage users, permissions, and collaboration.
- API: Create custom monitors, automations, and reporting workflows.
Pricing
Pulsetic has a free plan with 10 monitors/heartbeats/domains and SSL/port/TCP/ICMP monitoring.
Paid plans include:
- Solo at $9/month, with 10+ monitors, 60-second checks, 1 year of logs.
- Team at $19/month, with 50+ monitors, 30-second checks, 2+ teammates.
- Organization at $49/month, with 300+ monitors, 30-second checks, 5 years of logs, 3+ teammates.
Extra monitors, teammates, notify-only seats, SMS/call alerts, and status page subscribers are available as add-ons.
Pros
- Lightweight setup works well for smaller teams
- Generous free plan for basic monitoring needs
- Paid plans scale gradually with team growth
Cons
- Advanced incident workflows appear less mature
- Add-ons can complicate final monthly costs
- Lower plans may feel limited quickly
7. Pinghome
Pinghome is a practical option for teams that want to monitor specific ports without overcomplicating setup. It supports both TCP and UDP port checks, making it useful for tracking the availability and performance of network services, mail servers, and other port-based systems.
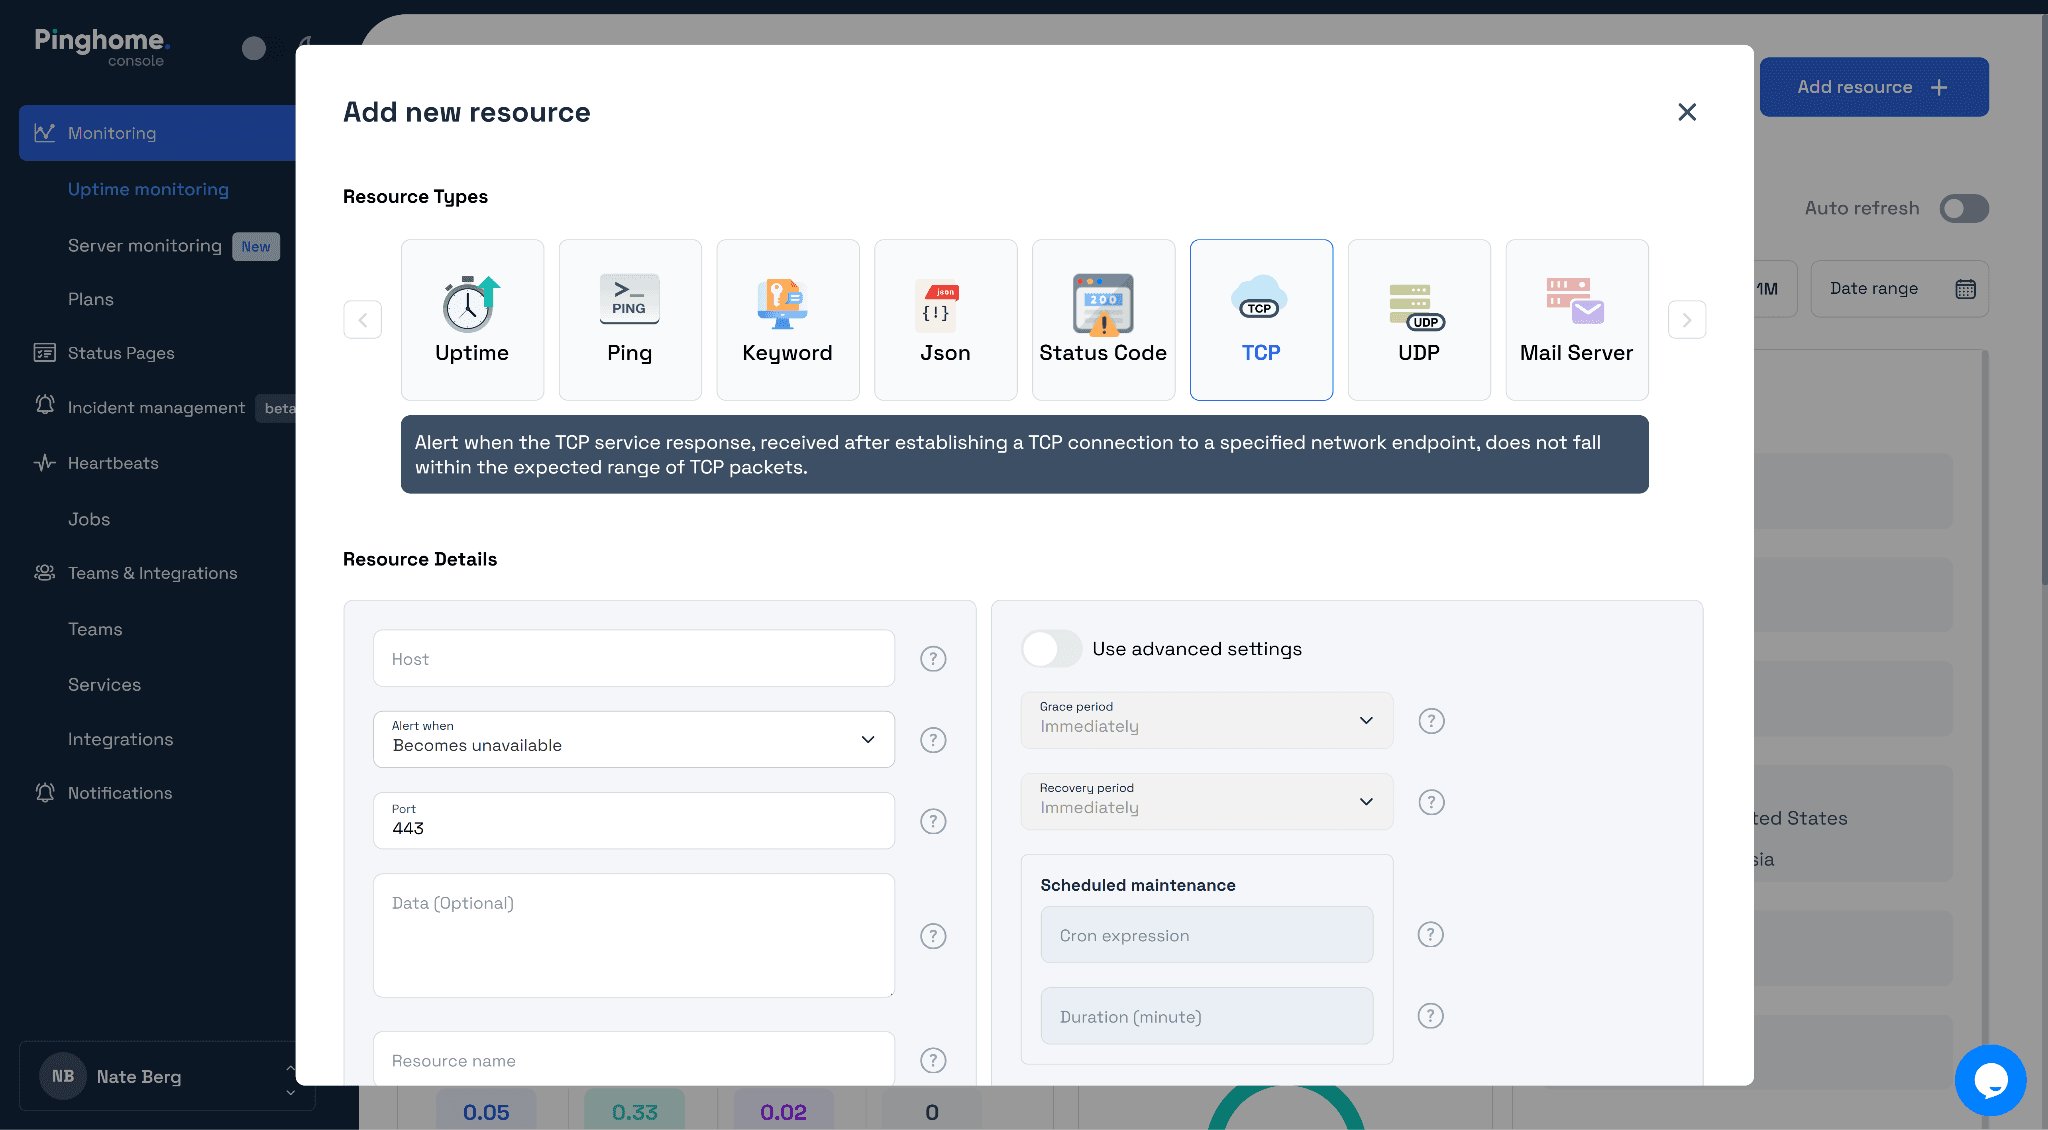
Pinghome is big on flexibility. It allows teams to choose which ports to monitor, track response times and latency, and receive alerts through the channels that fit their workflow.
Key Features
- TCP and UDP Monitoring: Monitor port availability and performance across both protocols.
- Mail Server Monitoring: Track SMTP, POP3, and other mail-related service ports.
- Performance Tracking: Measure response times and latency to spot bottlenecks or congestion.
- Custom Port Setup: Configure the exact ports you need to monitor.
- Multi-Channel Alerts: Get notified by email, push notifications, SMS, Telegram, or phone call.
- Mobile Apps: Receive uptime reports and instant alerts on mobile.
Pricing
Pinghome has four paid plans:
- Starter starts at $12/month, with 15 uptime monitors, port checks, 2-region monitoring, 3 status pages, and 1 user.
- Basic costs $34.40/month, with 100 monitors, Slack, on-call scheduling, Teams, and advanced status pages.
- Pro costs $120/month, with higher limits, 100 status pages, and technical support.
- Enterprise is custom.
Pros
- Strong fit for teams monitoring mixed services
- Includes incident rules across higher plans
- Advanced status pages support customer communication
Cons
- Starter plan is quite limited for teams
- Some collaboration features start on Basic
- SMS requires separate add-on spending
Monitor Ports and Communicate Incidents From One Place
The best port monitoring tool is the one that matches your response workflow. Some tools handle simple uptime and port checks. Others focus on self-hosted monitoring, enterprise observability, network infrastructure, server metrics, or broader incident management.
For SaaS and DevOps teams, the bigger question is what happens after a port fails. With Instatus, you can monitor TCP and UDP services, alert the right responders, manage the incident, and update your status page from one place before customers ask.
Start free with Instatus and set up your first port monitor in a few minutes.

Get ready for downtime
Monitor your services
Fix incidents with your team
Share your status with customers