
We Share How to Calculate Uptime [+Best Practices]

Quick Summary
Learn how to calculate uptime with our clear, step-by-step guide. We explain how to define monitoring periods, track downtime, calculate uptime percentages, and accurately report reliability. You'll also learn some best practices that can help your team measure stability, improve system reliability, and communicate uptime clearly with users.
Looking For A Clear Way To Calculate Uptime?
If your service becomes slow or unavailable, users won't wait. In fact, a Google Study found that 53% of visitors abandon a site that takes longer than 3 seconds to load. This goes to show why tracking uptime and responding to outages quickly is a must for maintaining reliability.
In this Instatus guide, we'll explore how to calculate uptime, along with some best practices.
Why Listen to Us?
Teams from companies like Vercel, Restream and Sketch trust Instatus to monitor services, manage incidents, and publish status updates in one place.
Our platform tracks uptime, sends alerts through tools like Slack or email, and powers fast status pages to improve transparency and customer communication.

What Is Uptime?
Uptime measures how long a system, app, or website stays online and accessible. It's a key reliability metric, showing whether users can reach your service when they need it.
Note that uptime only shows whether a system is technically running. It does not measure usability or performance, so a service can still be slow, error-prone, or partially failing. Availability metrics provide a fuller picture of real user experience.
High uptime means your platform runs smoothly with minimal interruptions. Low uptime signals instability, pointing to potential technical issues or infrastructure weaknesses that need attention.
Teams track uptime as a percentage, such as 99.9% or 99.99%, reflecting the total time a system stays operational during a given period. Monitoring uptime consistently helps teams detect outages early, respond faster, and maintain a stable, reliable experience for users.
Why Should You Calculate Uptime?
- Measure Service Reliability: Uptime shows how consistently your system stays available. High uptime means a stable platform, while frequent downtime points to reliability issues that need attention.
- Detect and Fix Outages Faster: Tracking uptime helps you spot outages quickly and respond before users notice. Early detection reduces disruption and improves recovery time.
- Improve User Experience: Reliable uptime means customers can access services when they need them. Monitoring uptime helps prevent disruptions that affect usability and satisfaction.
- Support SLAs and Performance Goals: Uptime metrics provide measurable data for service level agreements and internal performance targets. Teams use these numbers to track system stability and accountability.
- Protect Business and Reputation: Frequent downtime can harm customer trust, reduce revenue, and impact brand perception. Monitoring uptime helps prevent these risks and maintain service credibility.
How to Calculate Uptime in 6 Steps
Step 1: Define the Measurement Period
Start by choosing the time window used for the uptime calculation. This period sets the baseline for everything that follows.
Most teams track uptime over consistent operational windows. Monthly and yearly periods are common because uptime usually appears as a percentage of time a service stays available during that interval.
Pick a timeframe that matches how your service runs and how reliability gets reported.
- Monthly Measurement: Popular for SaaS reliability tracking and SLA reporting
- Quarterly Measurement: Useful for infrastructure stability reviews
- Annual Measurement: Often used for long-term uptime targets like "four nines."
Keep the timeframe consistent across reports. Changing it mid-analysis hides real trends and makes uptime numbers misleading.
DevOps teams can align uptime tracking with release cycles or incident reports. That alignment can help engineers connect outages to deployments or infrastructure changes.
Clear measurement periods also make uptime easier to explain. When someone sees 99.9% uptime, they should immediately know the timeframe behind that number.
Step 2: Identify the Total Available Time
Next, calculate the total time your service should've been running during the measurement period. This number represents the maximum possible uptime. Every uptime calculation compares actual performance against this baseline.
Most SaaS platforms and web services run 24/7. In those cases, total available time includes every minute in the selected timeframe.
For example, a 30-day month contains 720 hours of total service time. If your system should stay online the entire month, those 720 hours represent the maximum uptime.
Some systems run on limited schedules. Internal tools, scheduled jobs, or region-specific services may only operate during defined hours. In those cases, calculate the total time based on those operating windows.
Keep the calculation simple and consistent.
- Convert the measurement period into one time unit
- Multiply days by expected operating hours
- Use the result as the total available time
Many teams track uptime in minutes or seconds because monitoring tools record outages with that level of precision. DevOps teams can standardize time calculations so uptime reports remain comparable across services, releases, and infrastructure environments.
Step 3: Record All Downtime Events
Now track every moment your service becomes unavailable. Accurate uptime calculations depend on clean downtime data. Miss an incident, and the final uptime percentage will look better than reality.
Downtime includes any period when users can't access your service normally. That can mean server crashes, API failures, network issues, or application errors.
Treat incident tracking like a core engineering practice. Record precise start and end times for every outage. Even short disruptions matter when calculating uptime.
Most DevOps teams can automate this process with monitoring checks that run continuously. Automated checks detect failures quickly and record incidents without relying on manual reports.
This is where you can use Instatus. Our tool helps teams monitor services using checks like website, API, SSL, ping, and DNS monitoring. When a failure appears, alerts trigger, and the incident timeline gets recorded.

Good incident records usually include:
- Exact start time of the outage
- Time the service recovered
- Total outage duration
- Affected system or component
These records become the foundation of your uptime calculation. Over time, they also reveal patterns (e.g., repeated outages, failure trends, or recurring incidents tied to specific systems or deployments) that help teams improve reliability.
Step 4: Calculate Total Uptime
Now, calculate how long your system actually stayed online. This step turns downtime records into a real uptime value.
Start with the total available time from Step 2. Then subtract the downtime you recorded in Step 3. The result shows how long the system operated normally.
This number represents the total uptime for the selected period.
Most teams follow a simple calculation:
Total Available Time − Total Downtime = Total Uptime
For example, imagine a service monitored for 720 hours in a month. If outages added up to 4 hours, the system stayed operational for 716 hours.
That number becomes the baseline used to calculate the final uptime percentage.
DevOps teams can automate this step with monitoring logs or incident records. Automated tracking removes guesswork and keeps uptime numbers tied to real events.
Keep time units consistent across the calculation. If downtime appears in minutes or seconds, convert the total available time to the same unit.
Consistent units prevent rounding issues and keep uptime metrics easy to compare across services. At this point, you have the key input needed for the final uptime percentage.
Step 5: Apply the Uptime Percentage Formula
Now turn the uptime value into a percentage. This makes the result easy to understand and share in dashboards, reports, and SLAs.
The percentage shows how often your service stayed available during the selected period.
Use this formula:
Uptime % = (Total Time − Downtime) ÷ Total Time × 100
Start with the total monitoring time from Step 2. Subtract the downtime you recorded earlier in Step 3. Then divide the result by the total time and multiply by 100.
This converts operational time into a reliability percentage.
For example, imagine a service monitored for 720 hours in a month. If outages totaled 4 hours, the calculation looks like this:
(720 − 4) ÷ 720 × 100 = 99.44% uptime
That percentage becomes the reliability metric most teams report.
You can also take an easier approach by proceeding with the total uptime you calculated in Step 4, dividing it by the total monitoring time, and then multiplying that by 100. For example:
716 ÷ 720 × 100 = 99.44% uptime
Small math mistakes can distort uptime metrics, especially when teams track targets like 99.9% or 99.99% uptime.
Once calculated, this percentage becomes the number engineers use to evaluate service stability.
Step 6: Interpret and Report the Uptime Result
Finally, look at the uptime percentage and understand what it really means. Small changes in the number can represent hours of downtime across a year, so interpretation matters.
For example, 99.9% uptime allows about nine hours of downtime per year. 99.99% reduces that to roughly fifty minutes. A single decimal point can signal a major improvement in reliability.
Engineering teams rarely look at uptime alone. Combine the percentage with incident timelines, deployments, and infrastructure changes. That context shows why outages happened and how stability improves over time.
Next, share the result clearly with stakeholders and users. Uptime metrics work best when they stay visible and easy to access within the team.
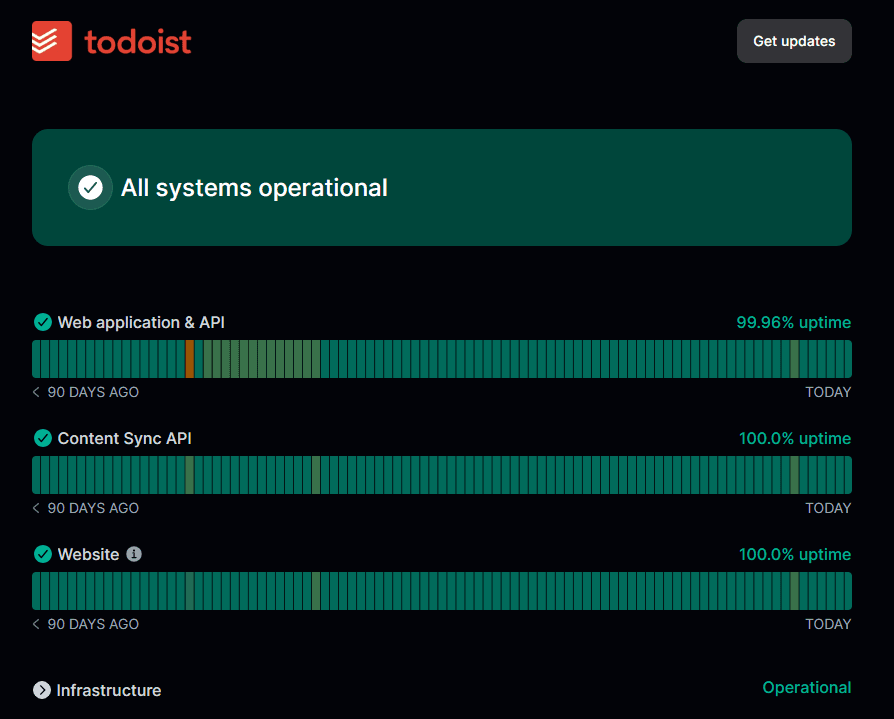
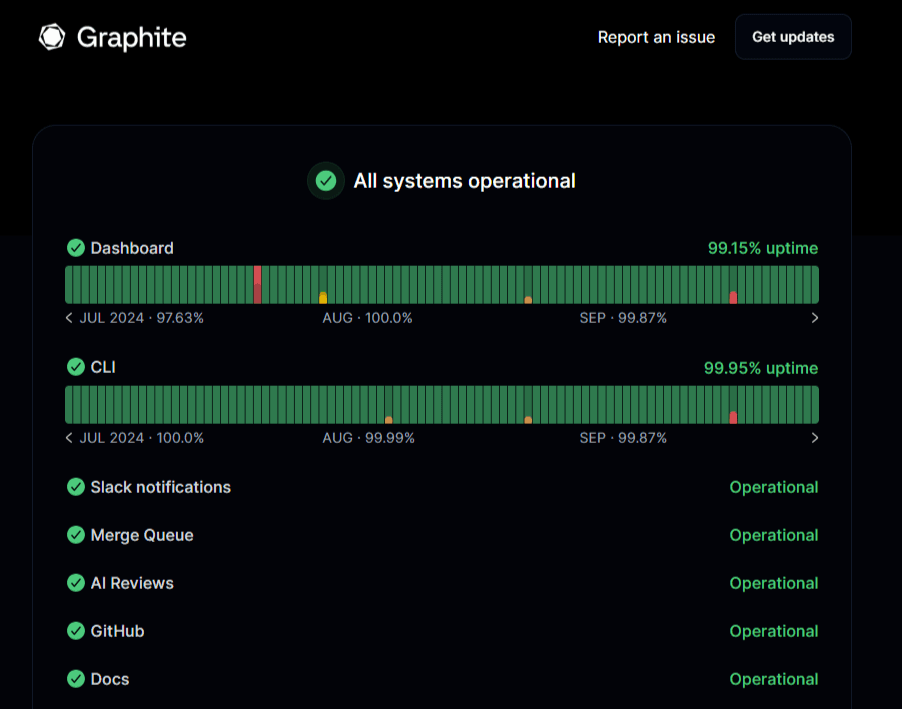
Many SaaS teams publish uptime on a status page. A status page shows current system health, incident updates, and historical uptime data in one place.
Tools like Instatus make this simple. Teams can display uptime history, track incidents, and post updates during outages without juggling multiple communication channels.
For instance, our tool can send status page updates and incident alerts directly to Slack channels, keeping teams informed in real time. Teams can also create or update incidents and maintenance notices from Slack using simple commands like /instatus.

Good uptime reporting often includes:
- Current system status
- Historical uptime percentage
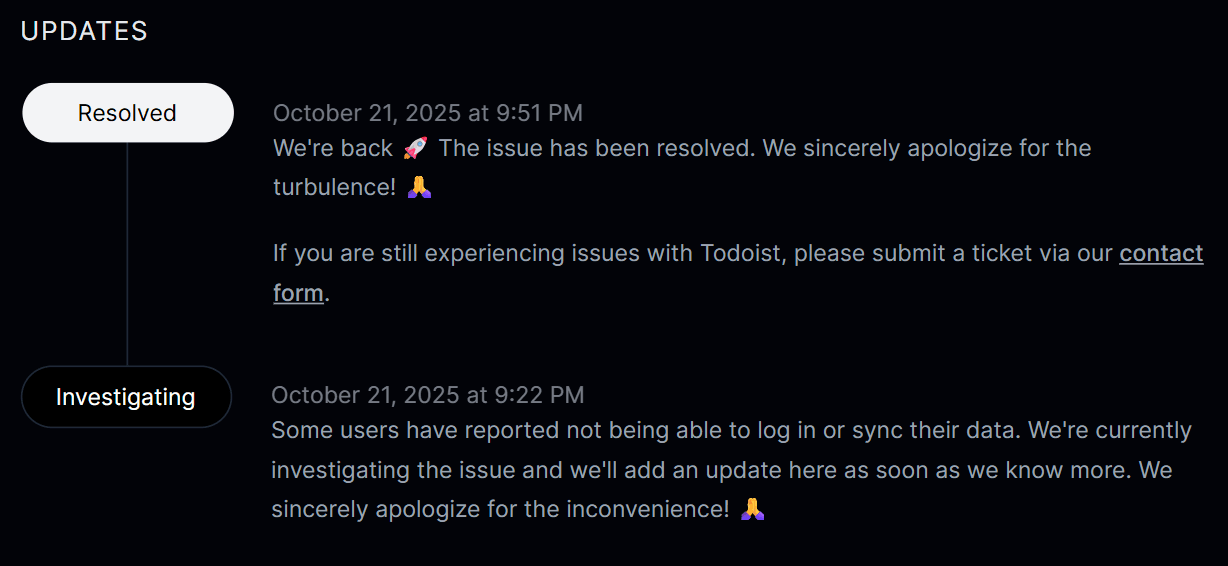
- Incident timeline and updates
- Scheduled maintenance notices
Clear reporting builds trust with users and keeps support teams from answering the same outage questions repeatedly.
When uptime data stays visible and well-explained, teams can track reliability trends and improve system stability over time.
Best Practices for Calculating Uptime
Define Downtime Criteria Clearly
Start by agreeing on what actually counts as downtime. Some teams only include full outages. Others also track degraded performance, failed API responses, or slow services.
Clear definitions keep uptime calculations consistent. They also prevent confusion when reviewing uptime reports or checking SLA commitments.
Many organizations document these rules in their reliability policies. Engineering, support, and product teams should all follow the same definition. That way, uptime metrics reflect the same operational standard across services.
Monitor from Multiple Geographic Locations
Monitoring from one server rarely tells the full story. Network routing issues or regional outages may affect users in one location while others see no problems.
Multi-location monitoring checks service availability from different regions. This gives a better view of real user experience across the globe.
It also reduces false alerts. If one monitoring node fails but others succeed, teams can quickly identify the issue as a local network problem instead of a system outage.
Tie Uptime Metrics to SLAs and SLOs
Uptime percentages mean more when they connect to reliability goals. Service Level Agreements (SLAs) define the uptime promised to customers. Service Level Objectives (SLOs) define internal reliability targets.
Many teams set SLOs slightly higher than their SLA commitments. That extra buffer gives engineers time to fix issues before uptime drops below the promised level.
Automate Monitoring and Incident Logging
Manual tracking leaves gaps, since outages can occur anytime, including nights or weekends. Automated monitoring continuously checks endpoints, logs incidents, and sends instant alerts to engineers. For example, Instatus monitors service availability and performance at regular intervals, recording uptime data while immediately notifying teams when failures occur.

Automation also reduces operational overhead. Teams spend less time logging incidents and more time resolving them.
Prioritize Monitoring for Critical Services
Not every system needs the same level of monitoring. Focus attention on services that directly impact customers, revenue, or core product functionality.
Many reliability teams follow an 80/20 approach (where 80% of results come from 20% of causes). A small group of systems often drives most user activity.
Prioritizing those services ensures uptime monitoring stays focused where reliability matters most.
Choose Instatus to Calculate Uptime with Confidence
Calculating uptime requires a clear process. Define the measurement window, track downtime precisely, and apply the uptime formula correctly. When teams manage this workflow well, reliability becomes easier to measure, improve, and communicate.
And Instatus makes this process easier.
Our tool helps SaaS teams, DevOps engineers, and developers monitor services, track incidents, and share uptime through a clean status page. Automated checks, alerts, and incident timelines keep downtime records accurate and uptime reporting transparent.
Get started with Instatus to track uptime and communicate incidents clearly.

Get ready for downtime
Monitor your services
Fix incidents with your team
Share your status with customers