
DevOps Metrics & KPIs to Fuel Growth

DevOps is all about continuous delivery and deployment, tight integration of development and operations teams, automation across infrastructure and application layers—in short, it’s the future of software development.
With that being said, DevOps isn't always easy. It takes careful monitoring and frequent adjustments to make it work! In this article, the Instatus team is going to be covering the DevOps metrics and KPIs you can monitor to inform those adjustments that allow your team to reap the rewards of the DevOps process.
Let's get started!
What are DevOps Metrics?
DevOps metrics are measurements used to quantify the efficiency, reliability, and performance of a DevOps project. By tracking key metrics and KPIs, DevOps teams are able to quickly identify and resolve bottlenecks before they threaten the success of a project as a whole.
Generally speaking, DevOps metrics report on one of two areas of the DevOps process:
- Technical Capabilities: These metrics measure the ability of a team to release software and services on schedule, meet or exceed customer expectations, and maintain a stable product.
- Team Processes: These metrics measure how well a team is working together from the standpoint of communication and productive output.
What are DORA Metrics?
Within the umbrella of DevOps metrics, there are a select few (four, to be exact) knows DORA metrics. DORA stands for DevOps Research and Assessment—it's a Google-owned research program committed to studying and improving the effectiveness of DevOps teams and processes.
In the course of their research, DORA has determined that there are four metrics that carry the greatest weight when it comes to optimizing DevOps teams. Basically, if you can only measure four metrics, choose these:
- Deployment Frequency
- Lead Time for Changes
- Mean Time to Recovery
- Change Failure Rate
Don't worry if this is the first time you're hearing about DORA or their metrics. In the section below, we'll be explaining what the DORA metrics are and how they work, along with introducing you ten secondary metrics you can use to improve your workflows.
14 DevOps Metrics You Need To Be Measuring
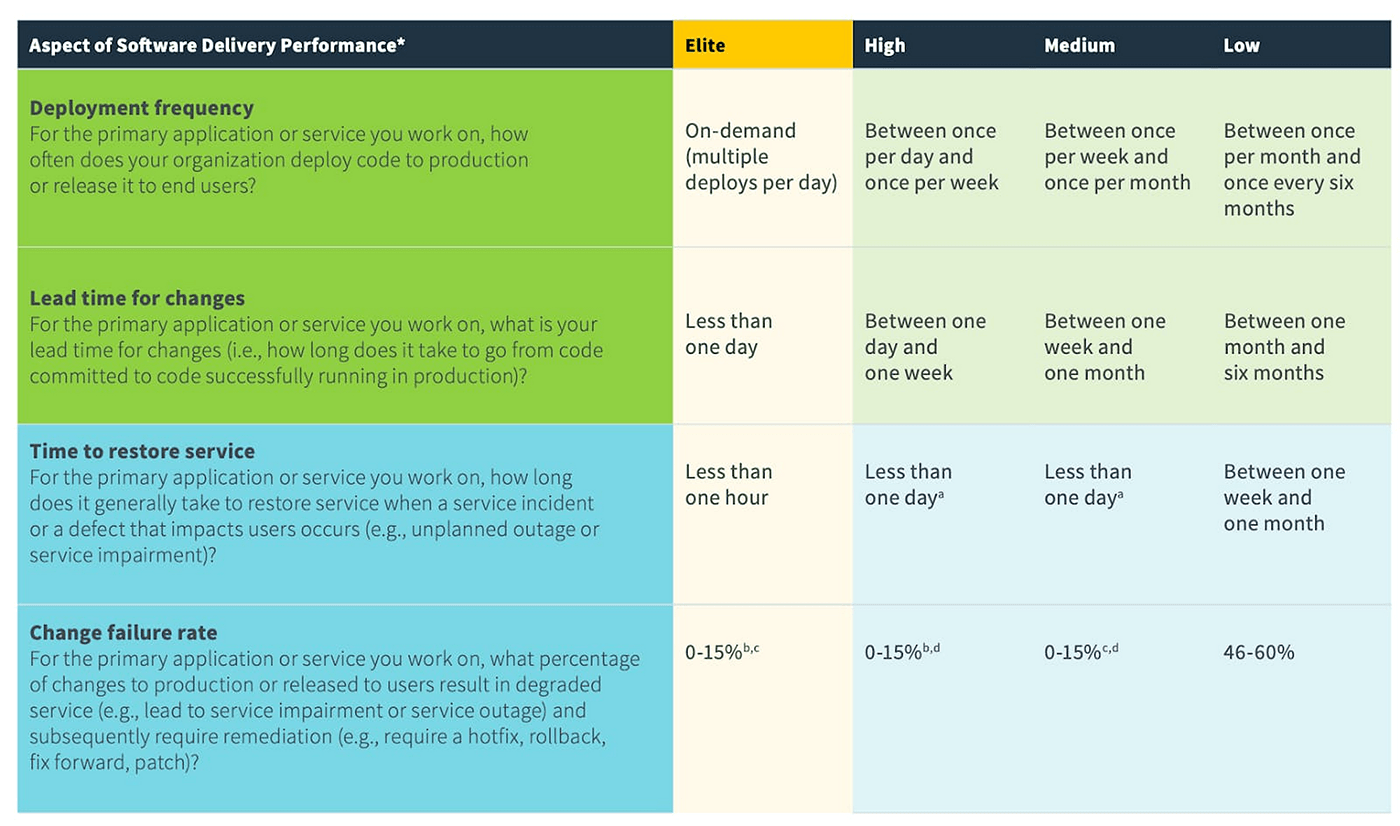
Deployment Frequency
Deployment frequency is the rate at which a new software version is released into production. It's an important metric to measure because it can indicate the stability and quality of a team's codebase.
High deployment frequencies usually mean that a team is releasing high-quality code, while low deployment frequencies may indicate that a team has difficulty shipping changes to production.
DORA Benchmark:
| Low Performers | Medium Performers | High Performers | Elite Performers |
|---|---|---|---|
| Between once per month and once every six months | Between once per week and once per month | Between once per day & once per week | On-demand or as required |
Lead Time for Changes
The Lead Time for Changes metric refers to the average time it takes from when a change is requested until it's live—or at least until it's ready to go live. This metric is especially useful in tracking how quickly your team can address and correct issues.
Ideally, you want the lead time for changes to be as short as possible, as this reflects how quickly your team can respond to customer needs and fix problems.
DORA Benchmark:
| Low Performers | Medium Performers | High Performers | Elite Performers |
|---|---|---|---|
| One to six months | One week to one month | One day to one week | Less than a day |
Mean Time to Recover (MTTR)
MTTR measures the average time it takes for a team to fix an issue after it's been identified. Regardless of the expertise of a DevOps team, issues and system outages arise—at Instatus we understand that better than most! For that reason, it's far more important to track your team's response to issues than it is to get hung up on the fact that an issue occurred.
This metric is especially important for companies that want to ensure their customers have a positive experience (which, in turn, leads to more business). A high MTTR means your team is struggling to keep up with customer demands, while a low MTTR reflects that you're able to quickly address and correct issues.
DORA Benchmark:
| Low Performers | Medium Performers | High Performers | Elite Performers |
|---|---|---|---|
| 1 week to 1 month | < 1 week | < 1 day | < 1 hour |
Change Failure Rate
The Change Failure Rate metric tracks the number of changes that failed to meet the organization's standards. Failed changes can have different implications, such as an application outage, data loss, or incorrect behavior.
This metric is captured by identifying all changes that were made, and then determining how many of them failed. Failed changes are usually caused by inadequate testing, late discovery of problems, or inadequate rollback plans.
Ultimately, this metric provides a measure of the accuracy and quality of changes being made to a system. By measuring change failures, businesses can work to reduce their occurrence and improve their overall change success rate.
DORA Benchmark:
| Low Performers | Medium Performers | High Performers | Elite Performers |
|---|---|---|---|
| 46-60% | 0-15% | 0-15% | 0-15% |
Availability
Measuring the availability of your systems and services is essential to understanding how well your DevOps process is working. Determining the percentage of time that your services are up and running will help you identify any potential issues before they cause major problems.
To track availability, you can use either uptime or downtime metrics. Uptime is a measure of the total time that a service is operational, while downtime is a measure of the total time that a service is unavailable.
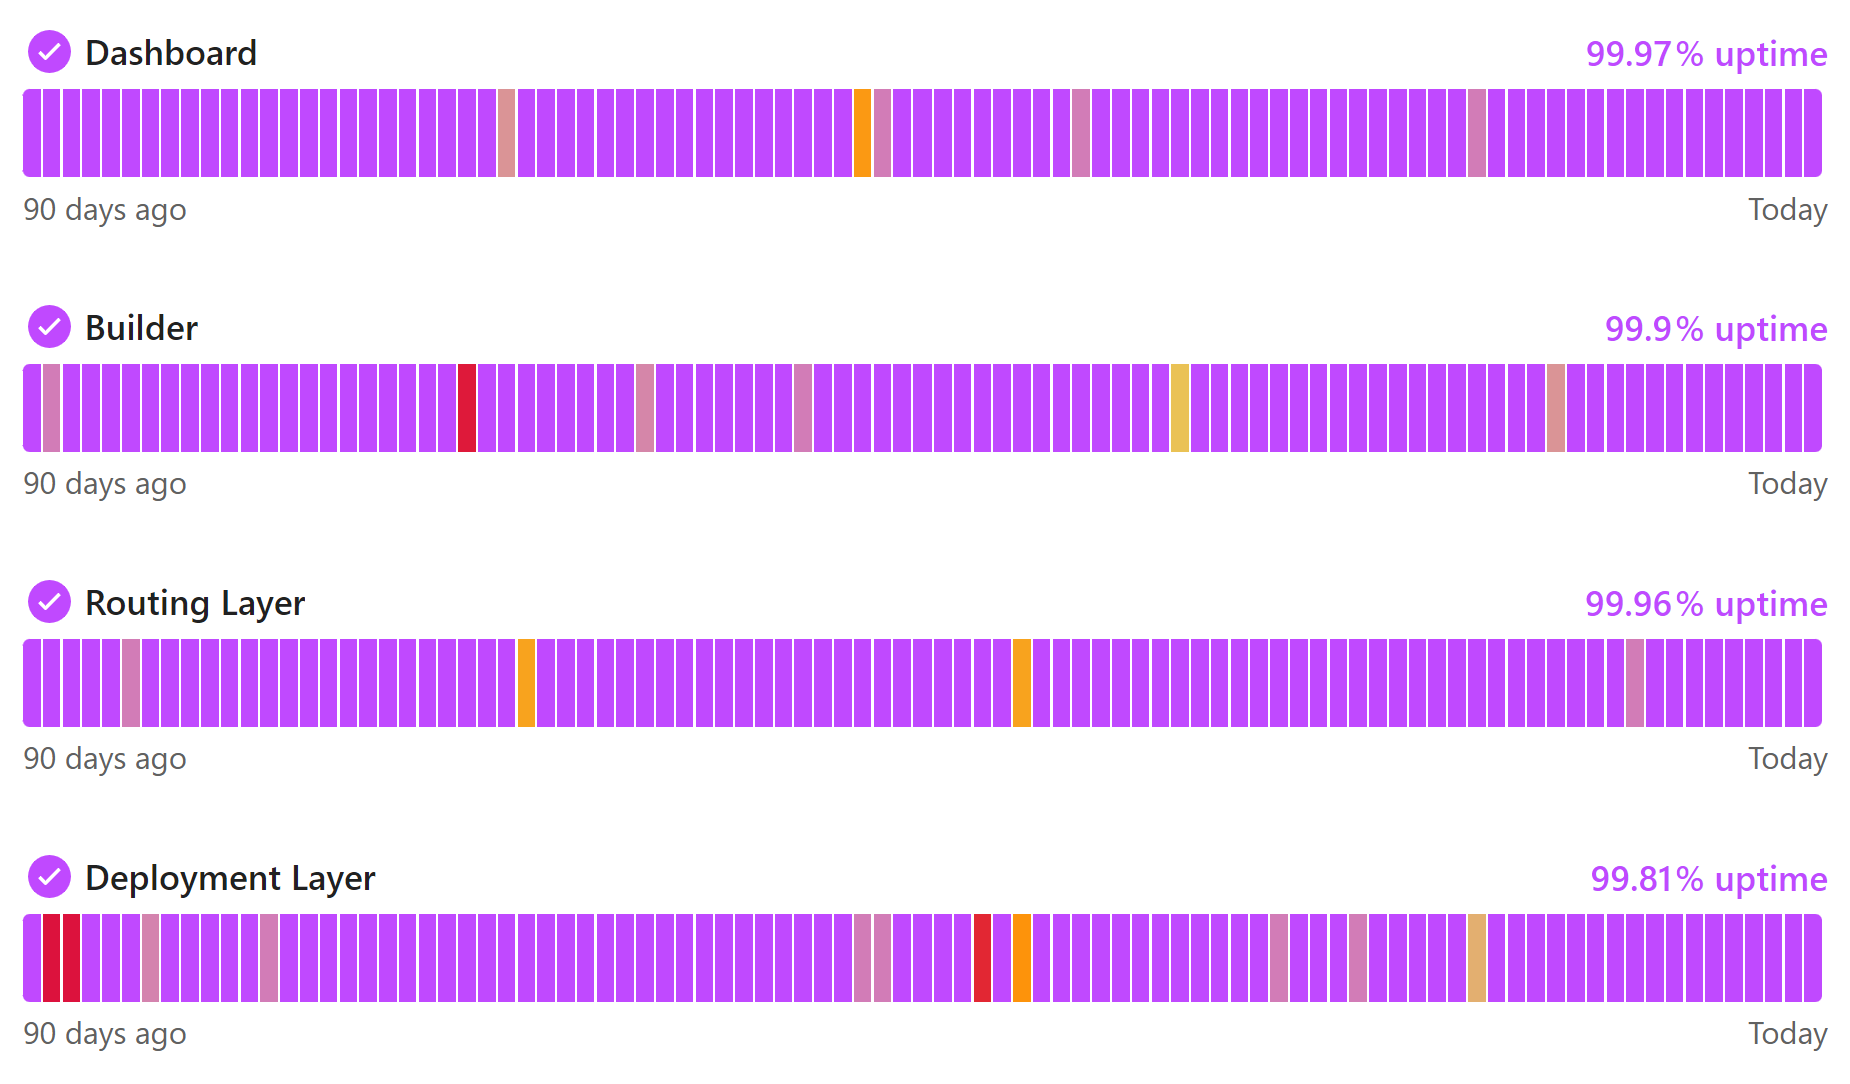
Instatus allows DevOps teams to track system uptime and downtime, as well as relay that information to users through clean, interactive status pages. Being proactive about system availability is a great way to increase trust in your organization and reduce the number of support tickets your team needs to deal with!
Response Times
The Response Times metric measures the time it takes for a system to respond to a request. This metric is important to measure because it can indicate how well your systems are able to handle current or future loads.
A high response time may mean that your systems are unable to keep up with the demand, while a low response time shows that your systems are able to handle the load. By measuring response times, you can work to improve your systems and ensure that they're able to handle the load when needed.
Work in Progress (WIP)
WIP is a measure of the amount of work that is currently being done. This metric is important to track because it can help organizations identify any potential bottlenecks in their process.
By measuring WIP, teams can determine if they have enough resources to handle the current workload and make changes if necessary. Additionally, this metric can help organizations plan for future growth.
Throughput
Throughput measures the amount of WIP that is put into production over a given period. A high throughput indicates that a team is regularly putting a ton of features or updates into the production pipeline—possibly too many!
Keeping tabs on your throughput and making sure the workload is key to avoiding missed deadlines and burnout—one of the many enemies of effective DevOps.
Customer Ticket Volume
Customer Ticket Volume is a great way to measure end user satisfaction. Why? Customers who are satisfied with your product or confident in your ability to fix a problem don't take the time to submit them!
In any DevOps process, bugs are bound to slip through the cracks in testing. Once a version is released, you're largely reliant on customer support tickets to identify any bugs you missed. That means Customer Ticket Volume is a great way to track:
- The overall reliability of your product.
- The effectiveness of your testing procedures.
- The state of end user satisfaction.

Tip: If you want to improve your Customer Ticket Volume, use Instatus to launch an interactive status page that keeps customers in the loop. They'll thank you for it!
Defect Escape Rate
Defect escape rate is like a scorecard that tells us how many bugs slipped through testing and made it into the final product. It enables your team to assess the effectiveness of the testing procedures. A lower defect escape rate is preferable because it indicates that you caught more bugs before releasing the product to customers.
When the rate is high, it means you missed many bugs, which suggests your processes need improvement. But when it's low, it's a sign that the code review and testing are doing an excellent job. So, by keeping an eye on this scorecard, you can improve the testing process and make sure the products are more reliable and bug-free.
Application Usage and Traffic
Application usage and traffic act like a traffic monitor for your system. It counts how many users visit your application once it's up and running. You can learn what is "normal" for your system by monitoring this data over time.
Therefore, when something uncommon occurs, such as a sudden change in traffic, it triggers a red alert. This allows your team to research and determine the root cause of the issue. It works like a radar for spotting possible problems early on, improving system stability and dependability for all of your users.
Error Rates
Error rates act like detectives, keeping an eye out for errors in your software. There are two types of errors they look out for: bugs and production issues. Bugs are sneaky errors that appear in software after it has been launched despite having passed all testing during the QA phase.
On the other hand, production issues are problems caused by external components like an API gateway. You can identify and address the underlying causes of these issues by tracking them separately, ensuring that the software functions properly and keeping users satisfied.
Mean Time To Failure (MTTF)
Mean time to failure (MTTF) measures how long a system can keep running before it experiences a breakdown. This metric is particularly useful for systems that can't be repaired. By knowing the MTTF, you can predict how long a critical component will function before it needs replacement, allowing your team to plan for potential costly failures.
To improve MTTF, you can use helpful tools like monitoring applications, logs, and tracing. These tools quickly detect and alert you about any issues. Additionally, automated workflows can be adopted to help spot and document problems, freeing up the team's time to focus on fixing the system. With these measures in place, you can make the systems more reliable and reduce the risk of unexpected downtime. It's like having a safety net to ensure operations run smoothly.
Average CI Duration
Software development is like a series of experiments. Small adjustments are made to test their effectiveness, and the CI pipeline provides the final decision. However, if the CI/CD process is slow, it becomes painful to work in small steps. It can be annoying to keep waiting for answers or to have your creative flow repeatedly interrupted. The CI pipeline ought to be completed as quickly as possible. This keeps developers interested and the code flowing easily.
What are the Benefits of Measuring DevOps Metrics?
There are a number of benefits to measuring DevOps metrics, including:
Increased Visibility and Control
By tracking and reporting on DevOps metrics, teams can gain increased insight into the status of their projects. This makes it easier to identify and fix problems before they cause major issues. Additionally, by monitoring KPIs, teams can ensure that they are meeting or exceeding goals and objectives.
Improved Efficiency
By identifying and resolving bottlenecks in the DevOps process, teams can improve their overall efficiency. This can result in faster time-to-market for products and services, as well as reduced costs.
Enhanced Customer Satisfaction
Increased customer satisfaction comes as a result of the two benefits mentioned above. By delivering high-quality products on or ahead of schedule, teams can improve customer satisfaction and retention rates. This can lead to increased revenue and market share.
Greater Scalability
When teams track DevOps metrics and use them to optimize their processes, it's much easier to scale their operations as needed. They're able to assess operations on an ongoing basis and make adjustments to improve them. This can help businesses grow more quickly and efficiently.
Wrapping Up
DevOps is a culture, practice, and set of tools that enables organizations to build, test, deploy, and monitor applications faster and more efficiently. DevOps metrics and KPIs allow businesses to measure the performance of their DevOps process and identify areas for improvement.
By tracking the key performance indicators (KPIs) for DevOps, businesses can optimize their operations and improve their bottom line.

Get ready for downtime
Monitor your services
Fix incidents with your team
Share your status with customers