
What Is Server Monitoring? How It Works & Why It Matters

Quick Summary
Server monitoring helps you catch issues early, reduce downtime, and optimize performance across your stack. Our article breaks down what server monitoring is, how it works, how it helps, and the key steps to set up a reliable system. Doesn’t matter if you're scaling fast or tightening operations, our guide gives DevOps teams and developers a clear, actionable path to better uptime and visibility.
Maximizing Uptime Through Proactive Server Monitoring
Servers go down, that’s just reality. But when they do, you should know it before your customers do. That’s where server monitoring comes in, tracking server health, performance, and uptime in real time.
Server monitoring helps you catch issues fast, fix them faster, and stay ahead of costly downtime. But how?
In this Instatus article, we’ll explore that, diving deep into the ins and outs of server monitoring. But first…
Why Listen to Us?
At Instatus, we deliver fast, customizable status pages with real-time monitoring, seamless integrations, and unlimited users at a fraction of the cost. Trusted by companies like Deno and Graphite, we help you reduce support tickets, build customer trust, and stay ahead of outages.

What Is Server Monitoring?
Server monitoring is the process of tracking the health, performance, and availability of a server. It helps detect issues early, like high CPU usage, memory leaks, or failed services, so you can fix them before users are affected.
It works by using monitoring tools that constantly check server metrics and send alerts when something goes wrong. These checks can run every few seconds and cover everything from uptime to response time.
During server monitoring, you must look out for:
- CPU load
- Memory usage
- Disk space
- Network traffic
- Running processes, and
- System logs
That way, you can catch slowdowns, crashes, or outages before they impact customers or critical systems.
Simply put, server monitoring gives you the visibility you need to stay proactive. It’s the difference between solving a problem and being surprised by one.
Types of Server Monitoring Systems
There are a few main types of server monitoring systems. Each focuses on different parts of your server’s performance, and most teams use a mix to stay fully covered.
- Infrastructure monitoring checks the physical or virtual servers, CPU, RAM, disk, and network usage. It spots resource bottlenecks and helps plan capacity.
- Application performance monitoring (APM) looks at how software runs on the server. It tracks response times, error rates, and transaction speeds across services and APIs.
- Log monitoring scans system and application logs for errors, warnings, or unusual activity. It’s great for debugging and catching silent failures.
- Uptime monitoring tests if your server is reachable and responding. It usually includes ping, TCP, HTTP, and DNS checks from multiple global locations.
- Security monitoring flags unauthorized access attempts, config changes, and suspicious traffic. It helps prevent breaches and detect attacks early.
Each system serves a purpose. Together, they give a full picture of server health—from hardware to apps to security.
Server Monitoring vs. Server Performance Monitoring
Server monitoring and server performance monitoring are closely related, but they focus on different goals. Here's how they differ in scope and purpose:
- Focus: Server monitoring tracks overall health and uptime. Server performance monitoring dives into speed, load, and responsiveness.
- Metrics: Server monitoring checks availability, errors, and basic resource usage. Server performance monitoring tools measure latency, throughput, and efficiency.
- Purpose: Server monitoring ensures systems stay online. Server performance monitoring helps optimize how well they run under load.
Both are essential, one keeps things running, the other keeps them running smoothly. Using them together gives a complete view of server stability and speed.
Benefits of Server Monitoring
-
Faster Issue Detection and Resolution
High memory usage, slow disk I/O, or dropped packets can quietly grow into full outages. Monitoring tools let you catch these early and act before users notice.
Fast detection is not just about alerts, but about the right ones. Smart thresholds, anomaly detection, and pattern recognition help you cut through noise and focus on real risks.
With real-time checks and historical context, you don’t just spot what broke, you understand why. That’s key for root cause analysis and long-term fixes.
Here’s what speeds up response even more:
- Automated incident creation tied to alerting thresholds
- On-call rotations and escalation paths
- Centralized logs linked to performance metrics
- Picking the right alert cadence, real-time or batch, based on how critical the system is
The result: faster fixes, fewer surprises, and happier customers.
-
Improved Uptime and Reliability
Downtime kills trust and momentum. Server monitoring helps you stay ahead of it by catching warning signs before they escalate, like rising CPU load, slow response times, or service flaps.
Monitoring lets you run health checks from multiple regions and detect outages even when internal systems look fine. That’s crucial for distributed SaaS teams and global platforms. It also gives you the data to fine-tune deployments, test redundancy, and validate failover strategies under load.
With consistent monitoring in place, you reduce firefighting and build confidence in your stack’s ability to stay up no matter what.
-
Better Resource Management
Servers rarely fail from lack of hardware, they fail from unmanaged load. Monitoring helps you spot inefficient processes, memory bloat, or traffic spikes before they hit limits.
This is not only about cutting costs. It’s about making systems smoother and scaling smarter.
Use metrics to:
- Identify over-provisioned resources
- Tune workloads based on demand
- Plan infrastructure upgrades with real usage data
How to Monitor Server Performance
Step 1: Set Up Key Metrics and Baselines
Start with the essentials: define what “healthy” looks like for your servers. This means identifying the right metrics and setting performance thresholds based on historical patterns and current needs.
Don’t monitor everything, but what matters. Focus on metrics that reflect system behavior and user impact:
- CPU, memory, disk I/O, networking, and general resource usage
- Uptime and response time from external checks
- Process health and queue lengths
- Application-specific metrics like DB connections or request rates
- Web-focused metrics like Time to First Byte and Page Load Time
Collect baseline data under normal load for each. That gives you a reference point to catch anomalies early. It’s also smart to check for faults, corrupt files, and security issues that could silently compromise your system’s integrity.
Make sure alerts align with your baselines. Triggering alerts for every spike burns out your team. Use thresholds, smoothing, and suppression windows to keep signals meaningful.
If you’re using tools like Datadog, Prometheus, or New Relic, you can pipe those metrics directly into your status page through our integrations.

This helps surface meaningful trends to your team or users in a lightweight, readable format.
By grounding your monitoring setup in real metrics and well-calibrated thresholds, you’ll spend less time guessing and more time reacting to the right signals.
Step 2: Use Monitoring Tools and Integrations
Once your metrics are in place, connect them to tools that can collect, visualize, and alert on them in real time. Choose platforms that support fast polling intervals, flexible dashboards, and standard integrations.
Good tools centralize your data. Great tools help you act on it. Prioritize options that offer:
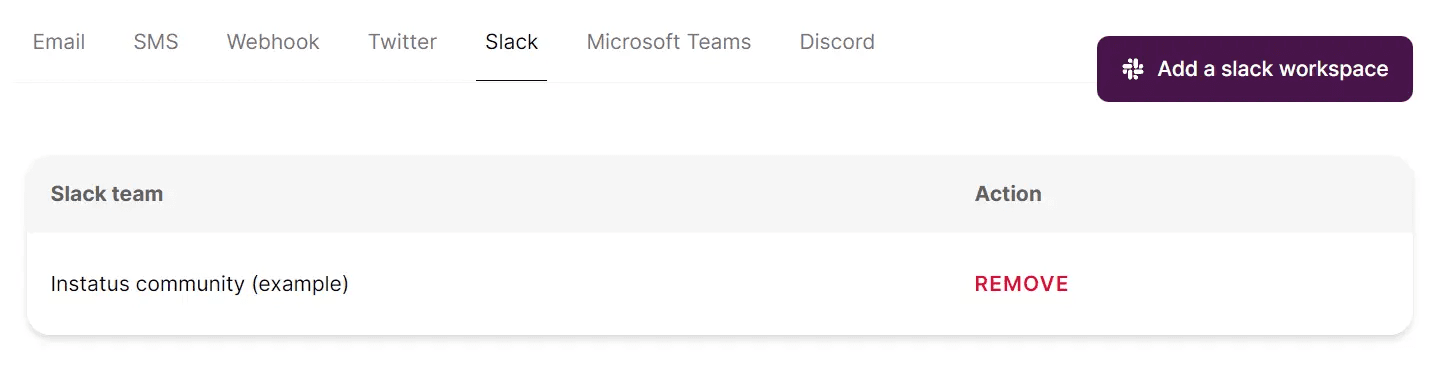
- Real-time alerts via Slack, Teams, SMS, or webhook
- API access for custom workflows
- Multi-location checks to catch regional issues
- Log aggregation and trace correlation
- Support for agent-based or agentless monitoring depending on your setup and security needs
That’s how you start gaining visibility into the activity on your servers, not just collecting raw numbers
Instatus fits neatly into this stack. It doesn’t replace your monitoring tools, it amplifies them. When you integrate services like Pingdom, Better Uptime, or Site24x7 with our tool, any incident those platforms detect can instantly update your status page.

That means no context-switching, no manual updates, and no confusion during outages. The right people stay in the loop, and customers see clear, timely updates.
For internal use, connect Instatus to your monitoring tools to keep teams aligned during incidents. For external use, provide status transparency without exposing raw monitoring data.
These integrations turn raw telemetry into action. They reduce guesswork, speed up response times, and help teams and users know what’s going on. All without the need to jump across platforms.
Step 3: Respond and Optimize Continuously
Start with clear escalation paths and on-call schedules. When an alert fires, the right person should know, act, and log the outcome.
Use post-incident reviews to surface weak points and trends.
Was the alert noisy? Did it lack context? Was the fix obvious or hard to find?
Optimize based on those answers.
If you're using Instatus, you can streamline incident response by automating alerts, status updates, and escalation workflows. Teams can:
- Trigger status changes from monitoring tools

- Use Slack to collaborate and post updates
- Document resolution steps in real time
These workflows don’t just improve response, but also reinforce learning. Every incident becomes a data point for system and process improvement.
Iterate on what works. Retire what doesn’t. Over time, alerts get sharper, fixes get faster, and your team becomes better at systematically tracking, measuring and observing the operations and processes on your server.
Step 4: Visualize and Share Performance Data
There’s no use of getting all this data if you don’t understand it. Once you’re done collecting performance metrics, the next step is to visualize them clearly and contextually.
Use dashboards to track real-time and historical trends. Group metrics by service, environment, or team responsibilities. Avoid clutter and show only what matters to the task at hand: system health, key dependencies, and active alerts.
Don’t just build dashboards for ops teams. Create views tailored for engineering, support, and leadership. Everyone needs different levels of insight.
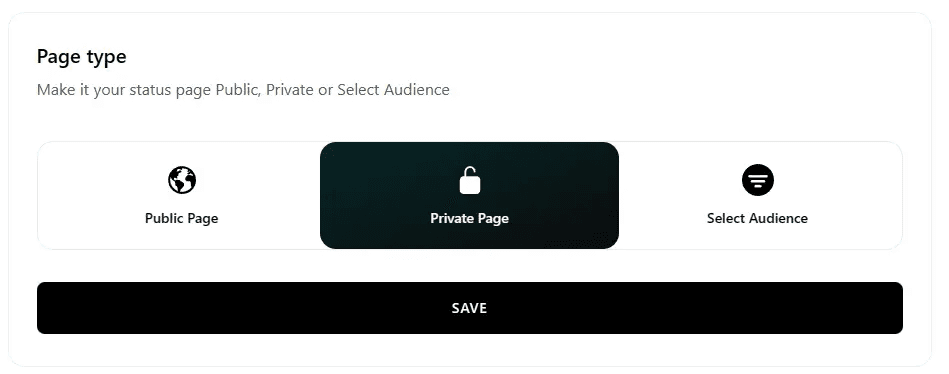
Here’s where our tool can help. With integrations that pull from platforms like Datadog, Site24x7, or Better Uptime, you can reflect current system status on public or private pages automatically. This removes the manual work of sharing updates during incidents.
Use these visual tools to:
- Highlight performance improvements after a fix
- Spot regressions across releases
- Communicate outages clearly without extra support tickets
Shared visibility turns metrics into action. It keeps teams aligned, reduces confusion, and builds trust, both internally and with users. When everyone sees the same story, they can respond faster and more confidently. That’s what good monitoring is really about.
Best Practices for Server Monitoring
- Correlate Metrics across Systems
Single metrics rarely tell the full story. A CPU spike might look bad—until you see it lines up with a traffic surge and increased database calls.
Cross-referencing metrics across your infrastructure helps detect complex issues and eliminate false positives fast.
- Version Control Monitoring Configs
Treat your monitoring setup like code. Store alert rules, dashboards, and response runbooks in Git.
That gives you change history, team collaboration, and the ability to roll back configs that cause issues. It’s safer, faster, and scales well across teams.
- Test Failover and Alerting Systems
Don’t wait for production failures to find out if your alerts work.
Run chaos drills or inject faults into staging. Make sure alerts trigger, reach the right person, and lead to a quick response. Practice builds confidence and surfaces weak spots early.
- Sync Status Updates with Real Incidents
If your team is fixing an issue, your status page should reflect that.
Integrating tools like Instatus ensures updates go out automatically. This keeps your users informed and prevents your support team from getting flooded with tickets.

Streamline and Optimize Server Monitoring with Instatus
Monitoring your servers is not optional, it’s how you catch issues early, keep systems reliable, and optimize performance over time. With the right metrics, tools, and workflows, you can stay ahead of downtime. And that’s where Instatus fits in.
At Instatus, we connect with your monitoring stack to automate incident comms, streamline alerts, and keep your team and users in sync, all without extra complexity. Our tool is built for fast-moving DevOps and SaaS teams who care about clarity and uptime.
Join thousands of teams leveling up their monitoring by signing up at Instatus today.

Get ready for downtime
Monitor your services
Fix incidents with your team
Share your status with customers