

Best Prometheus Alternatives in 2026: 8 Tools Reviewed
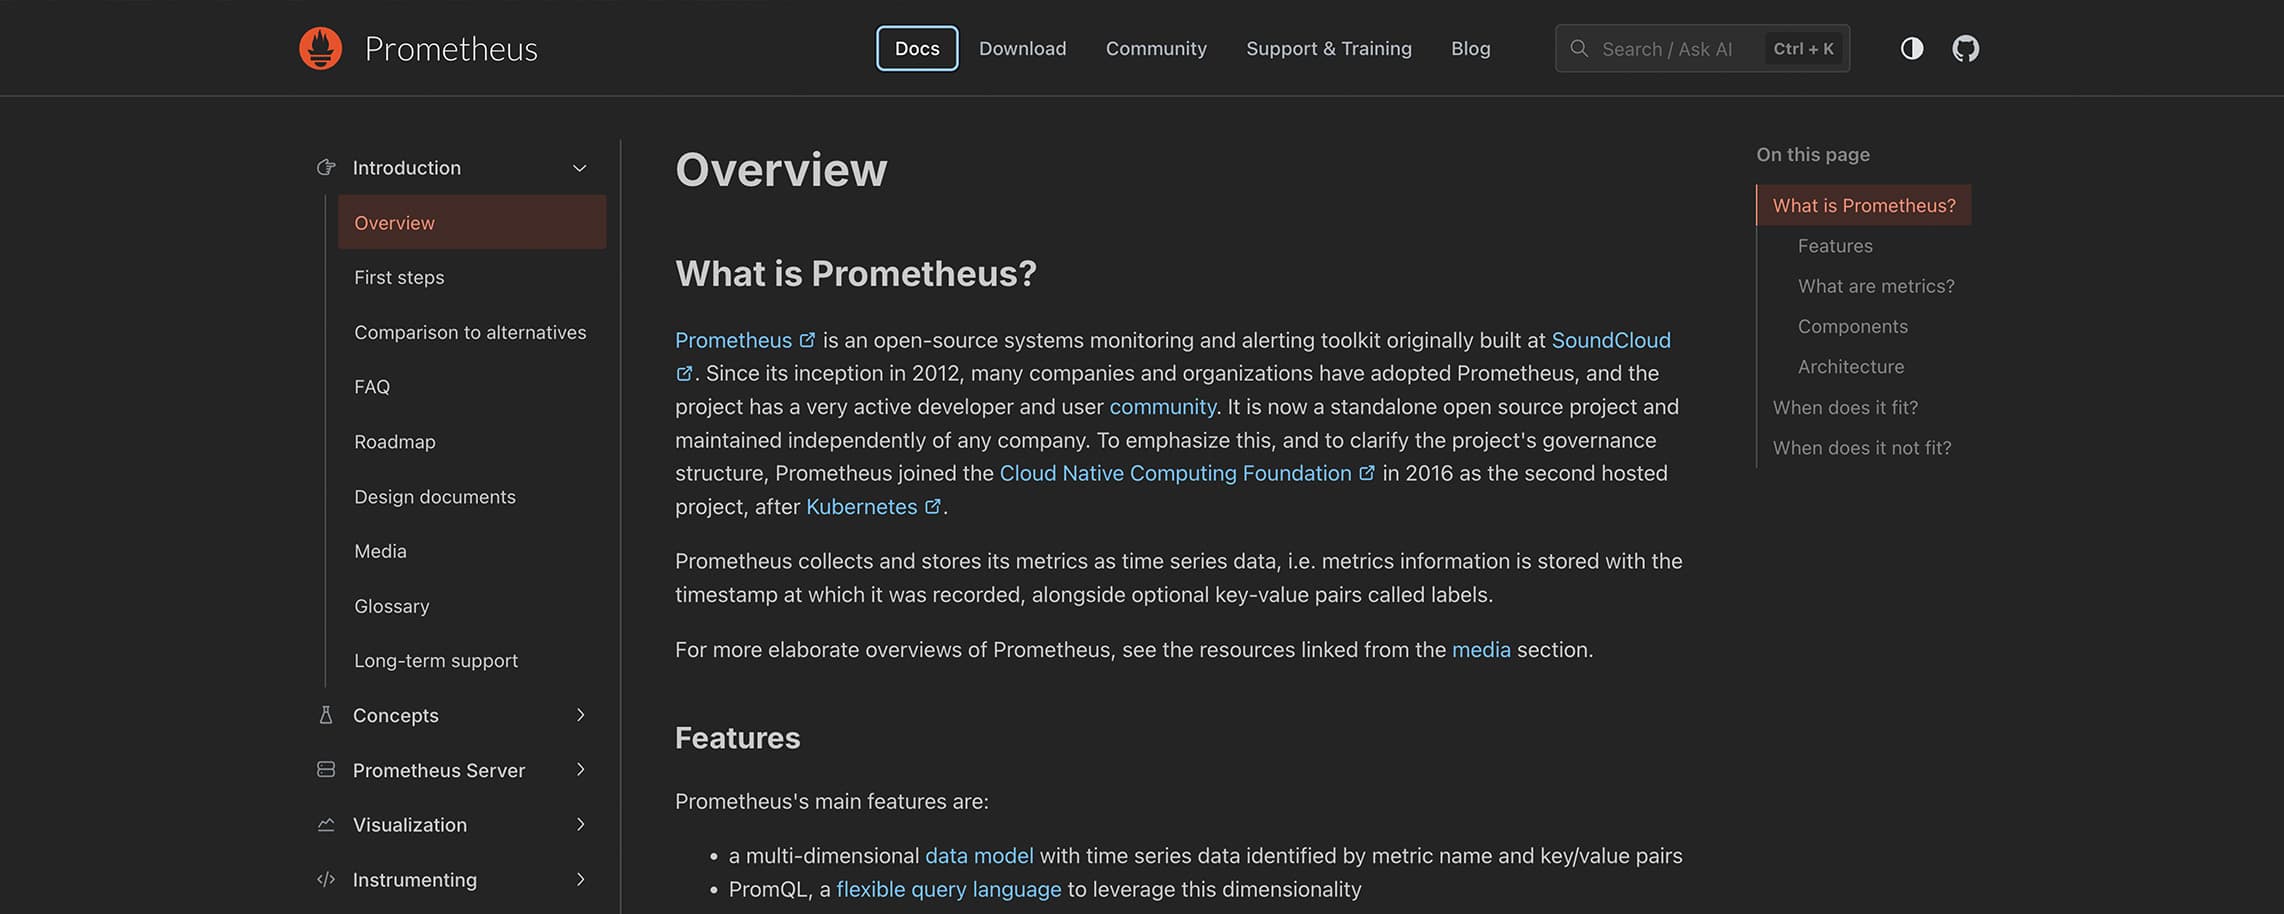
Quick Summary
This guide reviews eight Prometheus alternatives, including Grafana Mimir, VictoriaMetrics, SigNoz, InfluxDB, Datadog, Thanos, Zabbix, and Instatus, comparing features, pricing, and best use cases to help teams find the right monitoring setup. For more insights on uptime monitoring, observability, and incident workflows, visit the Instatus blog.
Is Prometheus Holding Your Monitoring Stack Back?
Prometheus is one of the most widely used cloud-native monitoring tools. It has CNCF backing, a pull-based scraping model built for Kubernetes, a large exporter ecosystem, and PromQL for querying time-series data. Engineering and DevOps teams use it to collect and store metrics from infrastructure and applications, especially in containerized environments.
But for many teams, Prometheus alone is not enough. Scaling, long-term storage, external monitoring, and customer communication all require additional tools or configurations beyond what Prometheus provides natively.
This Instatus article reviews eight Prometheus alternatives across open-source and managed options to help teams find the right fit for their monitoring stack.
Why Listen to Us?
Instatus powers uptime monitoring and status pages for thousands of SaaS and DevOps teams across 10,000+ status pages. We built a platform that handles incident detection, on-call alerting, and customer communication at scale, which means we understand how monitoring tools perform in real incident workflows, not just in controlled environments. That operational experience is what we bring to this review.
What Is Prometheus?
Prometheus is an open-source monitoring and alerting toolkit under the Cloud Native Computing Foundation (CNCF). It collects and stores time-series metrics from infrastructure and applications by scraping configured targets at regular intervals.
It evaluates alerting rules using PromQL and is commonly deployed with exporters to collect metrics from services, Kubernetes clusters, and infrastructure components. It is widely used by DevOps and SRE teams as the default metrics layer in cloud-native environments.
Key Features
- Pull-Based Metrics Scraping: Collects metrics from configured targets at regular intervals using HTTP endpoints, without requiring agents to push data.
- PromQL Query Language: Provides a flexible query language for filtering, aggregating, and alerting on time-series data across labeled metrics.
- Alertmanager Integration: Routes alerts to notification channels such as email, Slack, and PagerDuty based on configurable rules and silences.
- Exporter Ecosystem: Supports hundreds of exporters for collecting metrics from databases, hardware, cloud services, and third-party applications.
- Kubernetes-Native Design: Integrates natively with Kubernetes service discovery to automatically detect and scrape new targets as pods and services scale.
Pricing
Prometheus is open-source and free to use under the Apache 2.0 license. There is no commercial pricing for the core project. While the software is free, infrastructure, storage, and operational costs increase as deployments grow.
Limitations of Prometheus
- Single-node storage by default with no native high availability, requiring additional systems like Thanos or Grafana Mimir to scale.
- Short default retention period, with long-term storage requiring external object storage or federation.
- PromQL has a steep learning curve that can slow onboarding for teams without prior experience.
- Alerting runs through a separate Alertmanager component, adding configuration and maintenance overhead.
- Metrics-only design with no native support for logs or traces, requiring additional tools for full observability.
- No external or synthetic uptime monitoring, so customer-facing downtime can go undetected until users report it.
Top Prometheus.io Alternatives for Your Team
- Instatus
- Grafana Mimir
- VictoriaMetrics
- SigNoz
- InfluxDB
- Datadog
- Thanos
- Zabbix
1. Instatus
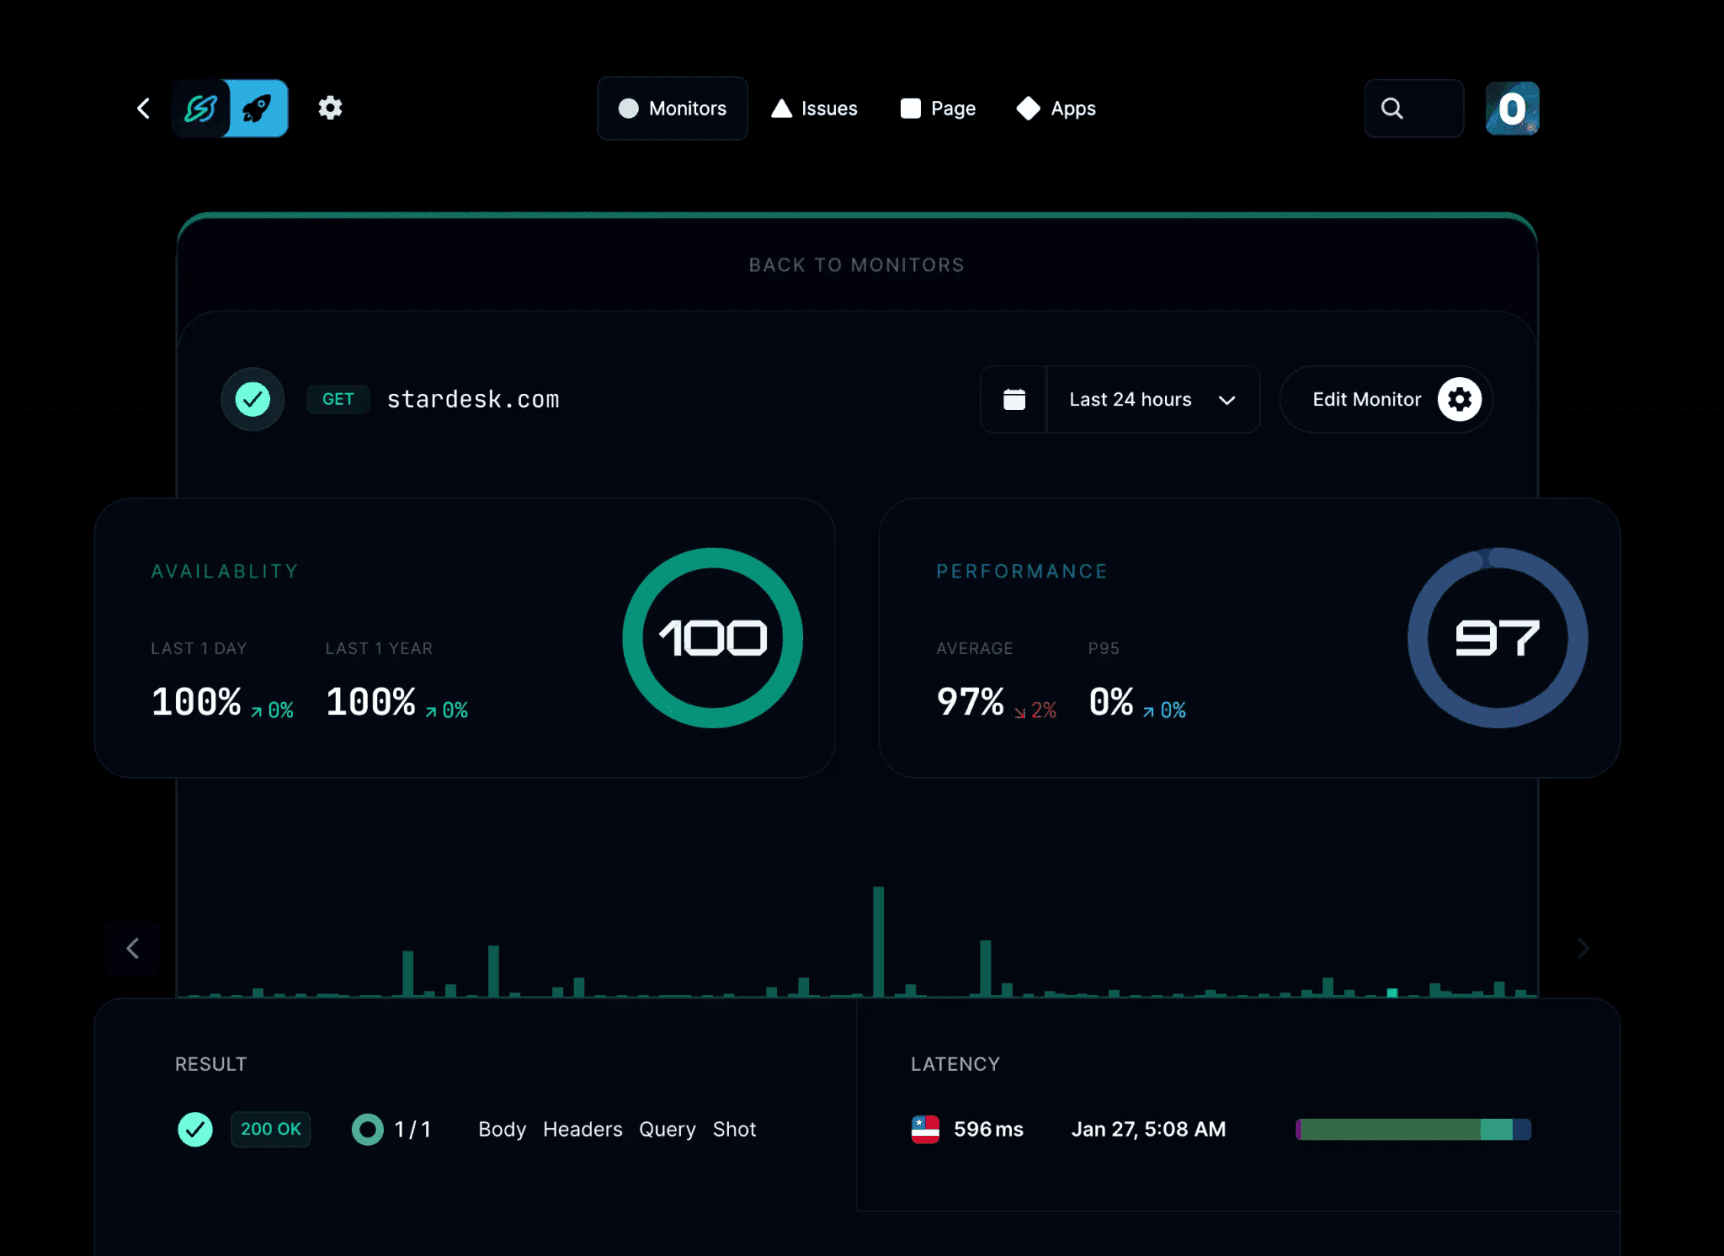
Instatus is an uptime monitoring and status page platform that covers the part of the monitoring stack that metrics tools do not: external service visibility and customer-facing incident communication. Where Prometheus detects internal target failures, Instatus monitors whether services are reachable from outside the infrastructure, keeps status pages updated, and routes the right engineer through on-call schedules and escalation rules.
It runs alongside whichever metrics backend a team uses as the customer-facing layer that metrics-only stacks leave uncovered. Trusted by teams at Todoist, Sketch, Siemens, Wistia, and Harvard University.
Setup is fast, and most teams can publish their first status page and monitoring checks within minutes.
Key Features
- Native Uptime Monitoring: Monitor websites, APIs, SSL certificates, DNS, TCP, ping, and keywords with 30-second checks from multiple global locations. This helps teams detect external downtime before users report it, without needing a separate monitoring tool.
- Slack and Microsoft Teams Incident Response: Manage incidents directly in Slack or Microsoft Teams with on-call schedules, escalation rules, and structured workflows. Teams can coordinate responses without switching tools.
- Branded Status Pages: Create public or private status pages with full customization, including branding and support for 50 languages. This allows teams to communicate incidents clearly to global users in real time.
- Multi-Channel Alerts: Send alerts via email, SMS, phone calls, Slack, Discord, and Microsoft Teams so the right responders are notified instantly through their preferred channel.
Pricing
Instatus uses flat monthly pricing with no per-seat charges:
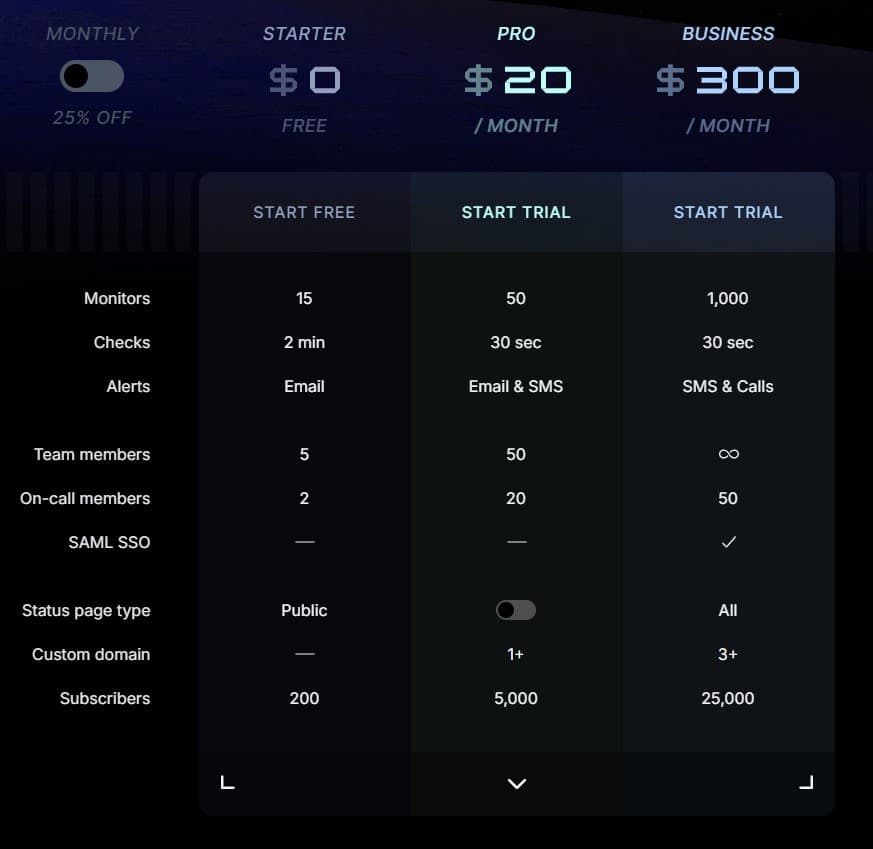
- Free: Basic monitoring and a single status page with limited checks and alerts.
- Pro ($20/month): More monitors, faster check intervals, SMS alerts, and expanded team capacity.
- Business ($300/month): Higher monitoring limits, phone alerts, SAML SSO, and expanded status page and subscriber capacity.
- Enterprise (Custom): Tailored for large-scale environments with advanced controls and support.
Pros
- Zero infrastructure to manage; fully hosted SaaS platform
- Native uptime monitoring with checks from outside your infrastructure
- Built-in status pages for public and private incident communication
- Slack and Microsoft Teams incident workflows for real-time coordination
- Tiered pricing model keeps costs predictable compared to per-host or per-metric monitoring tools
Cons
- Focused on external uptime monitoring and incident communication, so it does not replace internal metrics or Prometheus-style observability
2. Grafana Mimir
Grafana Mimir is a horizontally scalable backend for Prometheus that provides long-term storage and high availability while remaining PromQL compatible.
Prometheus is typically deployed as a single-node system using local TSDB storage with limited retention. Grafana Mimir extends Prometheus by offloading metrics to object storage such as S3, Google Cloud Storage, or Azure Blob Storage, enabling long-term retention and horizontal scaling without changing PromQL queries or existing instrumentation. It is commonly used with Grafana dashboards and as part of the Grafana LGTM stack alongside Loki and Tempo.
Key Features
- Long-term Metrics Storage: Uses object storage such as S3, GCS, or Azure Blob Storage to remove local disk retention limits and enable scalable storage.
- Native Multi-Tenancy: Isolates data per tenant across ingestion, storage, and query execution for large-scale or multi-team setups.
- Grafana LGTM Stack Integration: Works natively alongside Loki for logs and Tempo for traces, providing a unified observability stack without additional configuration for teams already using Grafana.
- High Availability Architecture: Replicates and distributes data across multiple components to improve reliability and fault tolerance.
- PromQL Compatibility: Works with existing Prometheus queries, alerts, and dashboards without modification.
Pricing
Grafana Cloud Metrics offers a Free tier ($0) with limited usage. Pro is priced at $6.50 per 1k active series, plus a $19/month platform fee. Enterprise starts at a $25,000/year spend commit.
Pros
- Integrates with Grafana, Loki, and Tempo in the LGTM stack
- Managed Grafana Cloud option removes infrastructure management
- PromQL-compatible, so existing Prometheus dashboards and alerts work without changes
Cons
- Self-hosting is complex due to its distributed, Kubernetes-based architecture
- Less mature operational track record compared to older systems like Thanos
- Higher resource usage compared to single-node Prometheus or simpler storage backends
3. VictoriaMetrics
VictoriaMetrics is a Prometheus-compatible time-series database used as a storage backend when Prometheus becomes expensive or difficult to scale. It is typically adopted as a drop-in replacement for Prometheus storage while keeping existing scrape configs, Grafana dashboards, and alerting rules unchanged.
Where Prometheus struggles at scale due to local disk storage limits, memory usage, and short default retention, VictoriaMetrics replaces the storage layer with a highly compressed engine designed for lower CPU, memory, and disk usage. This makes it more efficient in large environments, especially Kubernetes-heavy systems where Prometheus can become resource-intensive.
It is commonly used by teams that want to continue using Prometheus but reduce infrastructure cost and operational overhead, without moving to a full observability platform like Grafana Mimir or Thanos.
Key Features
- MetricsQL: PromQL-compatible superset, so existing Prometheus queries work without modification
- High Compression Storage: Reduces storage usage significantly compared to Prometheus, lowering infrastructure costs at scale
- Flexible Deployment: Runs as a single-node binary for simple setups or as a clustered system for large-scale environments
- vmAlert and Alerting Support: Includes a built-in alerting component compatible with Prometheus alerting rules and Alertmanager, allowing teams to migrate alert configurations without rewriting them.
- Managed Option: VictoriaMetrics Cloud provides a hosted version for teams that do not want to self-manage infrastructure
Pricing
Open-source and free to self-host. VictoriaMetrics Cloud uses fixed capacity tiers, with additional usage costs.
Pros
- Very low resource usage compared to Prometheus and most drop-in alternatives
- PromQL-compatible, so existing queries and Grafana dashboards work without changes
- Handles high-cardinality workloads that typically degrade Prometheus performance
Cons
- Built-in visualization is minimal, so Grafana is typically used for dashboards
- Smaller community than Prometheus or Grafana ecosystem, with fewer ready-made resources
- MetricsQL is not 100% identical to PromQL, which can cause edge-case query differences
4. SigNoz
SigNoz is an OpenTelemetry-native observability platform that combines logs, metrics, and traces in a single interface built on ClickHouse.
While Prometheus only handles metrics, SigNoz adds logs and traces so engineers can connect metric spikes with logs and traces during incidents. ClickHouse is used as the storage layer for high-volume logs and traces with fast analytical queries at scale. PromQL is supported alongside SigNoz's query language, so existing Prometheus dashboards and alert rules can be reused.
It is typically used to replace separate Prometheus, logging, and tracing tools with a single OpenTelemetry-based system. The trade-off is operational overhead in self-hosted setups due to ClickHouse scaling and maintenance requirements, while SigNoz Cloud removes infrastructure management.
Key Features
- ClickHouse Storage: Columnar database designed for high-volume metrics, logs, and traces in a single system
- OpenTelemetry Native: Uses OTel instrumentation without proprietary agents or vendor-specific formats
- PromQL Support: Compatible with PromQL alongside SigNoz's native query interface for reuse of existing dashboards and alerts
- Unified Observability: Combines metrics, logs, and traces in one platform for cross-signal debugging and analysis
- Exception and Error Tracking: Captures application exceptions and error rates directly alongside traces and metrics, reducing the need for a separate error monitoring tool.
Pricing
Self-hosted is open-source and free. SigNoz Teams Cloud starts from $49/month, with usage-based pricing for logs, traces, and metrics. Enterprise is available with custom pricing.
Pros
- Unifies Prometheus metrics, logs, and traces in one platform
- Actively maintained as an open-source project with frequent updates
- OpenTelemetry-native, avoiding vendor lock-in on instrumentation
Cons
- ClickHouse self-hosting requires operational effort for scaling and maintenance
- More setup and infrastructure management than managed-only observability tools
- UI and workflows are less mature compared to commercial platforms like Datadog
5. InfluxDB
InfluxDB is a time-series database used for metrics and event data, especially where teams need push-style collection, IoT data, or non-Kubernetes sources.
Unlike Prometheus, which primarily scrapes metrics from Kubernetes-style targets, InfluxDB supports both push and pull data collection. This makes it suitable for IoT devices, sensors, industrial systems, and external data sources that cannot expose Prometheus endpoints. It uses Telegraf as a collection agent, with 200+ integrations for ingesting data from infrastructure, applications, and hardware systems.
InfluxDB supports long-term retention and scalable storage for high-volume time-series data compared to Prometheus' local disk and shorter default retention model. The v3 architecture introduces SQL-based querying and improved scalability, but migration from v1 and v2 is not fully backward-compatible and requires configuration changes.
Key Features
- Telegraf Data Collection: Push and pull ingestion using 200+ input plugins for infrastructure, applications, and external systems
- SQL Query Engine (v3): Replaces Flux with SQL-based querying for time-series data
- Scalable Time-Series Storage: Supports configurable retention policies and high-cardinality workloads in v3
- Retention Policy Management: Supports configurable data retention policies per database, allowing teams to automatically expire older data and manage storage costs automatically.
- InfluxDB Cloud: Managed hosting option for teams that do not want to self-manage infrastructure
Pricing
InfluxDB 3 Core is free to self-host. Cloud Serverless has a free tier, with 30-day retention, while paid usage-based pricing applies to higher limits and usage.
Pros
- SQL-based querying in v3 reduces reliance on Flux
- High write performance for large-scale time-series ingestion
- Strong fit for IoT, sensor, and analytics workloads outside Kubernetes
Cons
- InfluxDB 3 Core is single-node, so scaling requires Enterprise or Cloud
- Migration from v1/v2 to v3 is not a drop-in upgrade and requires setup changes
- v3 architecture changes (storage and query model) require workflow adjustments from previous versions
6. Datadog
Datadog is a fully managed observability platform used by enterprise engineering teams running large-scale cloud infrastructure. It consolidates metrics, logs, traces, and APM into a single SaaS platform.
Unlike Prometheus-based setups that require multiple tools to correlate metrics, logs, and traces, Datadog provides this natively in one interface. Engineers can move from infrastructure metrics to application traces and related logs within the same workflow. Its Watchdog feature detects anomalies across services without manual configuration.
The trade-off is cost and vendor lock-in. Datadog is fully SaaS with no self-hosted option, and pricing scales with hosts, logs, and ingestion volume, which can become expensive in high-cardinality or log-heavy environments.
Key Features
- Watchdog AI: Continuous anomaly detection across metrics, logs, and traces
- Integrations: 1,000+ integrations across AWS, Azure, GCP, Kubernetes, and common infrastructure tools
- Unified Observability: Correlates metrics, logs, and traces in a single workflow for investigation
- Agent-Based Collection: Lightweight agent setup for infrastructure and application monitoring
- Live Process and Container Monitoring: Provides real-time visibility into running processes and containers directly within the infrastructure monitoring view.
Pricing
Free tier (5 hosts, 1-day retention), Pro starts from $15/host/month, and Enterprise from $23/host/month billed annually. Incident management modules are priced separately.
Pros
- Minimal setup with production-ready defaults from day one
- Deep observability across metrics, logs, traces, and APM in a single platform
- Fast correlation from infrastructure metrics to traces and logs during incidents
Cons
- Per-host, high-watermark billing can make costs unpredictable at scale
- OpenTelemetry-derived metrics can increase custom metric usage and cost
- Pricing complexity increases with multiple billable components (hosts, logs, metrics, and APM)
7. Thanos
Thanos is a Prometheus extension for high availability, long-term storage, and global querying across multiple Prometheus instances. It is used when Prometheus is limited by local disk storage, short retention, and single-cluster scaling constraints.
Thanos runs alongside Prometheus using a sidecar that uploads metric blocks to object storage such as S3, GCS, Azure Blob, or OpenStack Swift. This removes Prometheus storage limits and keeps existing PromQL queries, dashboards, and alert rules unchanged. It also provides global querying and deduplication across Prometheus replicas.
The trade-off is operational complexity. A production deployment requires multiple components, including sidecar, querier, store gateway, compactor, and receiver, each adding deployment and maintenance overhead.
Key Features
- Object Storage Backends: Supports S3, GCS, Azure Blob, and OpenStack Swift for long-term metric storage
- Global Query Layer: Provides a unified query view across multiple Prometheus instances
- Compaction and Downsampling: Reduces storage cost through automatic metric compaction and downsampling
- Multi-Cluster Federation: Enables a single query interface across multiple Prometheus instances running in different clusters, removing the need to query each instance separately.
- Prometheus Compatibility: Uses native Prometheus TSDB format so existing queries, dashboards, and tooling work unchanged
Pricing
Open-source and free. Infrastructure and object storage costs apply separately.
Pros
- Adds high availability and long-term storage via object storage
- Widely adopted CNCF project for Kubernetes-based monitoring
- Keeps existing Prometheus configs, queries, dashboards, and alert rules
Cons
- Requires object storage and compaction management for long-term use
- Distributed setup with multiple components increases operational complexity
- No official hosted plan, so teams manage the infrastructure themselves
8. Zabbix
Zabbix is an infrastructure monitoring platform used for bare-metal servers, network devices, and legacy environments where Prometheus-based monitoring is less effective.
Unlike Prometheus, which relies on scraping HTTP endpoints in cloud-native environments, Zabbix uses a centralized polling model with SNMP, JMX, IPMI, agent-based, and agentless checks. This makes it better suited for monitoring network switches, routers, physical servers, and legacy systems without exporters.
The trade-off is operational overhead and scalability limits. Zabbix has a complex setup, an older UI, and a more admin-heavy workflow. In large environments, central server performance can become a bottleneck without careful tuning. Grafana is often used for modern dashboarding.
Key Features
- Auto-Discovery: Automatically detects and maps new nodes and assets
- Grafana Integration: Enables modern dashboarding and visualization via Grafana
- Enterprise Support: Commercial support contracts available through Zabbix SIA
- Built-In Alerting and Escalation: Supports configurable alert triggers, escalation policies, and notification channels without requiring a separate alerting component like Alertmanager.
- Monitoring Protocols: SNMP, JMX, IPMI, agent-based, and agentless monitoring across diverse infrastructure
Pricing
Open-source and free. Paid subscriptions and enterprise support plans are available through Zabbix SIA.
Pros
- No license fees regardless of deployment size
- Broad protocol support for legacy and mixed infrastructure environments
- Built-in monitoring for network devices, physical servers, and legacy systems
Cons
- Kubernetes monitoring requires additional setup and configuration
- UI is often considered outdated compared to modern observability platforms
- Centralized architecture can become harder to scale in very large environments
Choose the Right Prometheus Alternative for Your Stack
The right alternative depends on where Prometheus falls short for your team. If the bottleneck is storage and scale, Thanos or Grafana Mimir extend Prometheus without a full migration. If resource efficiency is the priority, VictoriaMetrics handles high-cardinality workloads with lower CPU and memory overhead. Teams that need full observability across metrics, logs, and traces can consolidate with SigNoz or Datadog. Mixed infrastructure with physical servers and legacy systems is better served by Zabbix, while IoT and push-based metrics collection fits InfluxDB.
These tools show your team what is happening inside your infrastructure, but not always what customers experience during an outage. External uptime monitoring, status pages, on-call scheduling, and incident communication sit outside the scope of every metrics-only tool on this list. Instatus fills that gap, running alongside whichever backend your team uses to cover what internal monitoring alone cannot provide.
Start using Instatus today to add external uptime monitoring and status pages to your existing monitoring stack.

Get ready for downtime
Monitor your services
Fix incidents with your team
Share your status with customers