
Prometheus vs Nagios: A Complete Comparison for 2026

Quick Summary
This article compares Prometheus and Nagios, showing Prometheus excels in cloud-native and Kubernetes environments, while Nagios handles traditional on-prem infrastructure. Both lack customer-facing incident communication. Instatus fills this gap with status pages, multi-channel alerts, and fast setup, reducing support load and building trust. Learn how to improve monitoring and incident communication by exploring related guides on our blog.
What You Need to Know Before Deciding
Every DevOps team eventually faces the same question: when something breaks, how do you know about it, and how do your customers find out?
Prometheus and Nagios are the two most common answers to the first part. Both are open-source, widely adopted, and capable. But they are built on fundamentally different assumptions about what modern infrastructure looks like, and choosing the wrong one creates friction that compounds over time.
This Instatus guide breaks down the real differences between the two, covers where each one makes sense, and addresses the one layer both tools consistently leave unfinished: telling your customers what is actually going on when an incident hits.
Why Listen to Us?
We build status pages at Instatus and have helped over thousands of SaaS and DevOps teams communicate outages to their users in real time. Our experience gives us a unique perspective on monitoring: even teams that detect incidents effectively often struggle to communicate them clearly. This guide focuses on closing that gap.

Prometheus vs. Nagios: Key Differences
Pull-Based vs. Agent-Based Collection
Prometheus scrapes metrics by pulling data from HTTP endpoints at scheduled intervals. Nagios uses agents installed on each monitored host that push check results back to a central server. In practice, Prometheus handles environments where services appear and disappear naturally. Containers spinning up and down do not require manual registration. Nagios requires you to add every new host to a config file by hand, which becomes a bottleneck the moment your infrastructure starts changing frequently.
Dynamic vs. Static Service Discovery
Prometheus discovers monitoring targets automatically. It has native integrations for Kubernetes pods, EC2 instances, DNS entries, and Consul without touching a config file when infrastructure changes. Nagios does not have this capability. If your infrastructure autoscales, Prometheus eliminates what would otherwise be hours of manual configuration work per week.
Alerting Architecture
Prometheus routes alerts through Alertmanager, a separate component that handles deduplication, grouping, silencing, and multi-channel routing to Slack, PagerDuty, email, and others. Nagios uses plugin-based notifications that are flexible but require significantly more manual setup for complex routing. A practical difference: Prometheus alert rules are written in YAML and can be version-controlled. Nagios alert configuration is harder to treat as code, which matters when your team wants repeatability across environments.
What Is Prometheus?
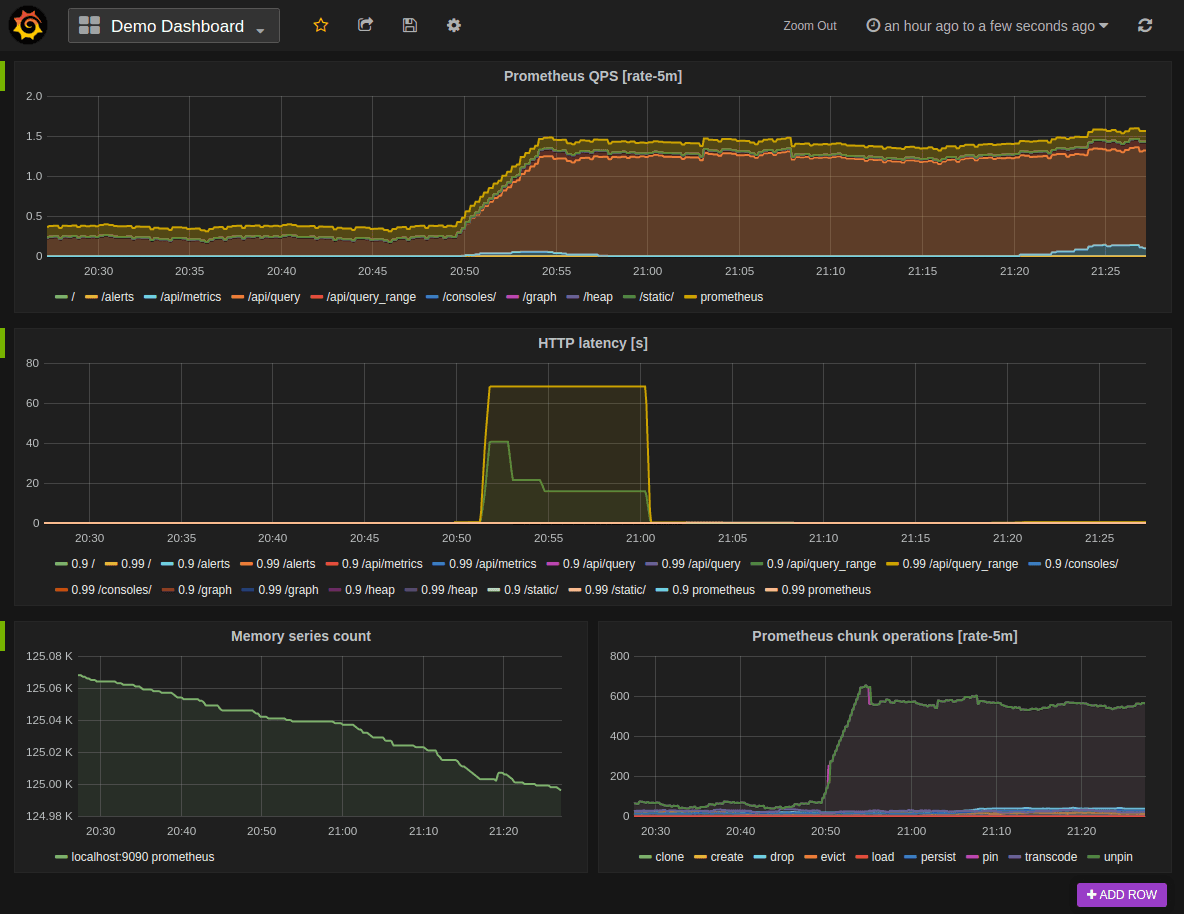
Prometheus is an open-source monitoring system built around a time-series database. SoundCloud created it in 2012. It was the second project accepted into the Cloud Native Computing Foundation after Kubernetes, graduating in 2018. It collects metrics from instrumented targets via HTTP, stores them with labels for multi-dimensional querying, and fires alerts when defined thresholds are met.
Its pull-based architecture and dynamic service discovery make it the natural choice for teams running containers, microservices, and autoscaling infrastructure.
Key Features
- Multi-dimensional data model: Identify metrics by name and key/value labels, enabling granular queries across services, environments, and instances simultaneously.
- PromQL querying: Write flexible time-series queries to slice, aggregate, and alert on collected metrics. A simple example:
rate(http_requests_total[5m])calculates HTTP request rate across all labeled services over a five-minute window. - Dynamic service discovery: Automatically detect and begin monitoring new targets in Kubernetes, EC2, DNS, and Consul without manual registration.
- Alertmanager routing: Route alerts to multiple channels with deduplication, grouping, and silencing rules to reduce alert fatigue at scale.
- Exporter ecosystem: Pull metrics from over 150 integrations covering databases, message queues, cloud services, and custom applications.
Pricing
Prometheus is free and open-source. Real costs come from infrastructure to run it, engineering time for ongoing maintenance, and the additional tooling most teams need: Grafana for dashboards, and Thanos or Cortex for long-term data retention.
Pros
- Purpose-built for Kubernetes and cloud-native infrastructure
- Free with CNCF backing, so ongoing development is stable and guaranteed
- Massive exporter ecosystem covers almost any technology stack
- Scales horizontally through federated instances
- Alert rules are YAML, version-controllable like application code
Cons
- Built-in UI is too basic for production use, so Grafana is required
- Long-term data retention requires additional tooling (Thanos, Cortex)
- No built-in access control, so an external proxy or VPN is needed
- PromQL learning curve is real for teams without prior time-series experience
- No customer-facing incident communication layer
What Is Nagios?
Nagios is one of the oldest infrastructure monitoring tools still in active use. Ethan Galstad created it in 1999, and it has been a default choice in enterprise IT environments for over 25 years. It works by running scheduled checks against hosts and services, including HTTP servers, network devices, databases, and Windows and Linux endpoints, then sending alerts when checks fail.
The product comes in three versions. Nagios Core is free and open-source but ships with a basic CGI web interface that most teams find inadequate for production use. Nagios XI is the commercial product with full dashboards and reporting. Nagios Fusion combines network, infrastructure, and log monitoring into a single view.
Key Features
- Plugin-based checks: Run thousands of community and custom plugins to monitor servers, network devices, applications, and services across diverse environments.
- SNMP and WMI support: Monitor network hardware via SNMP and Windows infrastructure via WMI, capabilities Prometheus handles through dedicated exporters rather than natively.
- Escalation and dependency tracking: Define alert escalation chains and service dependencies so a single root cause does not flood your team with downstream noise.
- Nagios XI dashboards: Configure and view monitoring through a web interface with capacity planning and scheduled reporting built in.
- Configuration snapshots: Save working configuration states and roll back immediately when a bad config change causes problems.
Pricing
Nagios Core is free. Nagios XI is the commercial version with professional support, advanced dashboards, and reporting. For teams that need real dashboards and reporting, Core alone is not a practical option, which means evaluating Nagios honestly means factoring in XI pricing.
Pros
- Enormous, mature plugin library covering legacy and niche systems
- Native SNMP support for comprehensive network device monitoring
- Battle-tested in regulated enterprise environments for over 25 years
- Configuration snapshot feature prevents config-related outages
- Nagios Core is genuinely free with no subscriber or team limits
Cons
- Core's CGI interface is inadequate for production use, so XI is required for real dashboards
- Static host registration does not scale with dynamic infrastructure
- No native Kubernetes or container support
- Documentation for advanced configuration is frequently outdated
- Config file complexity creates a steep learning curve for new teams
- No customer-facing incident communication layer
Instatus: The Best Status Page Integration for Prometheus and Nagios

Prometheus and Nagios detect problems and alert your engineering team. What neither tool was built to do is communicate those problems to the people using your product. That is the gap we built Instatus to fill.
We build status pages that sit between your monitoring stack and your customers. When an incident fires, your team can update a public or private status page in real time, send subscriber notifications across email, SMS, Slack, Teams, Discord, and webhooks, and give users accurate context while engineers work the problem. The result is fewer inbound support tickets, faster trust recovery, and customers who feel informed rather than ignored.
We power incident communication for engineering teams at Deno, Railway, Podium, Wistia, Harvard, and Restream. In a hands-on evaluation published on Medium by engineer Elliot Graebert, who tested Instatus against Atlassian Statuspage and Status.io across three evaluation rounds, Instatus came out ahead on integrations, customization, and notification options. Our status pages are static files delivered from a CDN, which means they stay available even when your own infrastructure is down. That matters most precisely when your status page needs to work.
Initial setup takes under 30 seconds. Full configuration including custom domain typically runs under 30 minutes, based on reviewer reports.
Key Features
- Public and private status pages: Publish customer-facing pages or internal ones for your team, with full brand customization including custom domain, colors, logo, and CSS.
- Monitoring integrations: Connect your existing tools to auto-update your status page when alerts fire. See all supported integrations, including Datadog, Pingdom, Site24x7, Uptime Robot, PagerDuty, and New Relic.
- Prometheus integration: Route Prometheus Alertmanager alerts directly to your status page. The Prometheus setup guide walks through the full connection.
- Multi-channel subscriber notifications: Keep users informed via email, SMS, Slack, Teams, Discord, webhooks, RSS, and Atom without manual effort during an active incident.
- Incident management: Build on-call schedules, set escalation and routing rules, manage incidents directly from Slack, add team comments, and collaborate across functions in real time.
- Uptime history display: Show historical uptime data publicly to build customer trust before anything breaks, not just during incidents.
- 21-language support: Serve a global audience with status pages automatically matched to visitor location.
Pricing
Instatus offers tiered plans to suit different needs: a Free tier with basic status pages and monitoring; Pro at $15/month, adding faster checks, SMS alerts, more team seats, and custom domains; Business at $225/month, expanding limits further with SAML SSO and higher subscriber counts; and Enterprise, with custom pricing for advanced requirements and support.

Pros
- Fills the customer communication gap Prometheus and Nagios were not built to address
- CDN-delivered pages stay available during infrastructure outages
- Integrates with your existing monitoring stack rather than replacing it
- Fast setup, with full configuration typically under 30 minutes
- No per-seat pricing that scales against you as your team grows
Cons
- No built-in user monitoring (integration required)
- Advanced enterprise features require higher-tier plans
Prometheus vs. Nagios vs. Instatus: Feature Comparison
| Feature | Prometheus | Nagios | Instatus |
|---|---|---|---|
| Architecture | Pull-based, distributed | Agent-based, centralized | Hosted, CDN-delivered |
| Service Discovery | Dynamic (Kubernetes, EC2, DNS) | Static, manual host registration | N/A |
| Kubernetes Support | Native | Plugin-required | N/A |
| Alerting | Alertmanager, multi-channel routing | Plugin-based notifications | Subscriber notifications |
| Visualization | Requires Grafana | Built-in dashboards (XI only) | Status page dashboard |
| Customer Communication | None | None | Core feature |
| Pricing | Free (open-source) | Free core / XI pricing at nagios.com | Free plan / see instatus.com/pricing |
| Setup Time | Hours to days | Hours to days | Under 30 minutes |
| Best For | Cloud-native, Kubernetes | Traditional on-prem infra | Incident communication |
Why Do People Choose Instatus?
Completes the Incident Workflow
Prometheus alerts your on-call engineer. Nagios pages your sysadmin. Neither tool tells your customers anything. Instatus adds the communication layer that turns a detected incident into a managed one. Teams that previously handled outages with mass emails, or said nothing until the incident was resolved, consistently report lower inbound support volume once a live status page is in place.
Works with Your Existing Monitoring Stack
Instatus integrates seamlessly with whatever monitoring tools you already use. Connect Prometheus alerts or Nagios check failures via webhooks or PagerDuty. Teams running hybrid setups can funnel multiple alert streams into one customer-facing page without rebuilding anything.
Builds Trust Before Anything Breaks
A public uptime history signals transparency to potential customers and enterprise buyers. Companies like Deno and Wistia use it as part of a broader reliability story, not just for incident response.
Take Control of Incident Communication with Instatus
Prometheus and Nagios each do their job well. If you run Kubernetes and microservices, Prometheus is the right foundation. If you manage traditional on-prem infrastructure and network hardware, Nagios still has no peer for breadth of coverage. Many mature engineering teams run both in parallel for hybrid environments.
Detection and alerting are only half the incident equation, though. When something breaks, your customers need to know what is happening. That is what we built Instatus for. If your team handles incidents without a public status page, you are losing support tickets and user trust that you do not need to lose.
Getting started takes 30 seconds and the free plan costs nothing. Set up your status page at instatus.com.

Get ready for downtime
Monitor your services
Fix incidents with your team
Share your status with customers