

Dynatrace Pricing Explained: Plans, Costs, and a Simpler Alternative
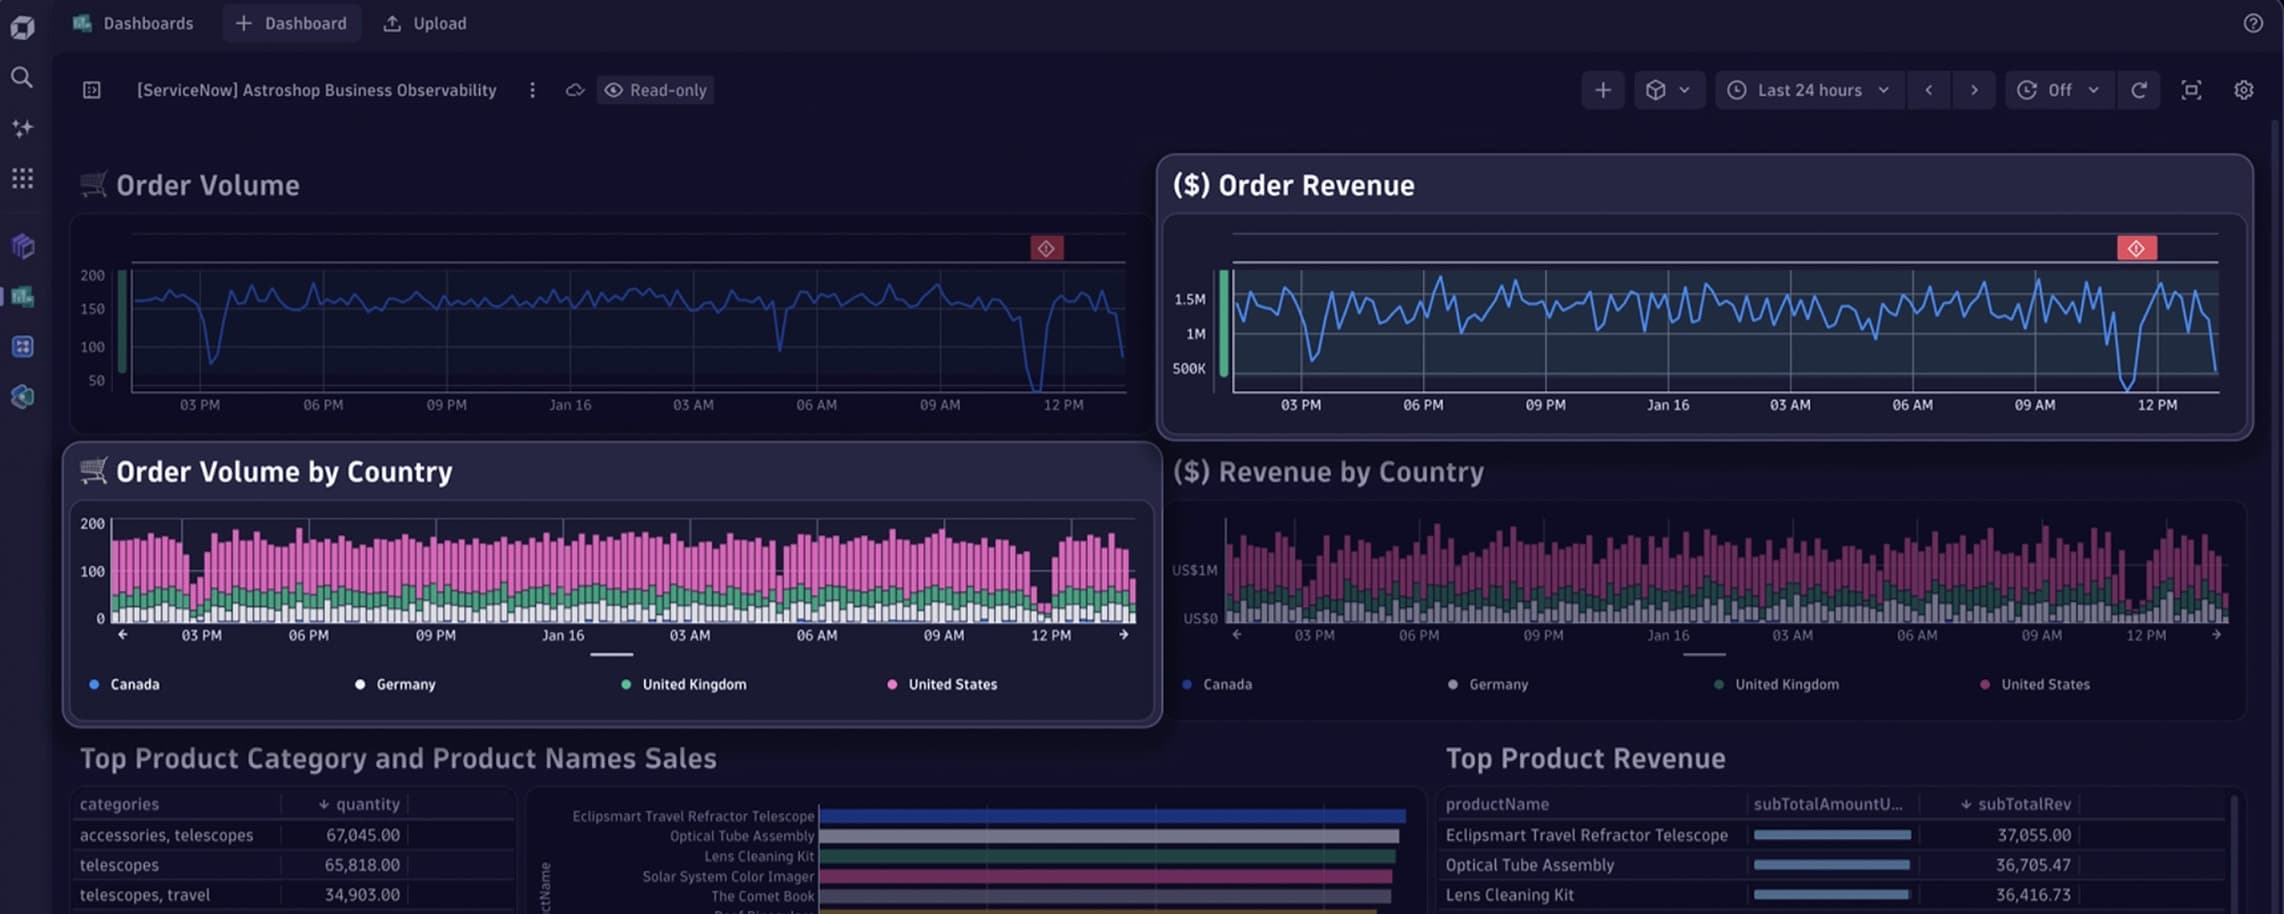
Quick Summary
Dynatrace pricing is usage based, so costs grow with host memory, data volume, synthetics, sessions, and enabled features. That flexibility suits deep observability workloads, but teams focused mainly on uptime checks and customer updates may not need the same breadth. This guide explains the plans, cost drivers, and when Instatus is the simpler fit.
Wondering if Dynatrace Is Still the Right Fit for Your Team?
Dynatrace is a deep observability and APM platform for applications, infrastructure, logs, traces and user experience. That depth helps engineers debug production issues. It is also why Dynatrace costs can be hard to forecast.
Your bill shifts with memory usage, data ingest and the capabilities you enable. For teams that mainly need uptime checks and customer updates, that depth can create a mismatch between the platform they are paying for and the workflow they actually need.
This Instatus guide walks through Dynatrace pricing, what drives the real cost and when teams using it mainly for incident communication move to a simpler tool.
Why Listen to Us?
We build Instatus for teams that monitor services, respond fast, and keep customers informed during downtime. Customers like Sketch, Airbyte, Harvard, Deno, Wistia, and Modern Treasury use Instatus, rated 4.8 on Capterra. We know when full observability helps and when teams just need reliable monitoring, incident response, and customer communication in one place.

How Dynatrace Pricing Works
Dynatrace runs on the Dynatrace Platform Subscription. You do not buy fixed seats, so unlimited users are included. Instead, you make an annual platform-level commitment, then each capability you use draws down that commitment at Dynatrace's rate-card prices.
The core monitoring options form a ladder, from basic infrastructure visibility to full application and infrastructure observability. Here is how they break down, using Dynatrace's published list prices.
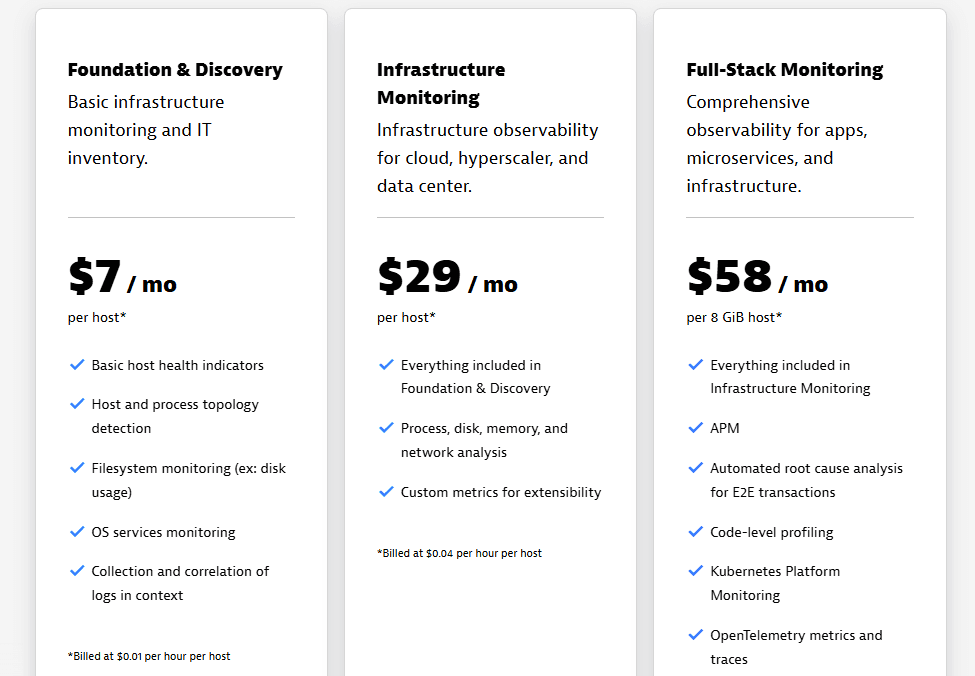
Foundation & Discovery
Built for broad, low-cost infrastructure visibility. It includes basic host health indicators, host and process topology detection, filesystem monitoring, OS services monitoring, and log collection in context. It lists at $7 per host per month, billed at $0.01 per hour per host.
Infrastructure Monitoring
Best for host-level operations without full application tracing. It includes everything in Foundation & Discovery, plus process, disk, memory, and network analysis, and custom metrics. It lists at $29 per host per month, billed at $0.04 per hour per host.
Full-Stack Monitoring
Built for teams that need application and infrastructure observability together. It includes everything in Infrastructure Monitoring, plus APM, automated root cause analysis, code-level profiling, Kubernetes Platform Monitoring, OpenTelemetry metrics and traces, and 10 days of trace retention.
It lists at $58 per month per 8 GiB host, billed at $0.01 per memory-GiB-hour. Cost scales with monitored memory, so larger hosts cost more than smaller hosts for the same monitoring time.
Consumption Add-Ons
Most teams layer more capabilities on top, and each one has its own usage meter:
- Log Management and Analytics: $0.20 per GiB to ingest and process. Retention and query costs depend on the model you choose. Pay-per-query pricing lists $0.0007 per GiB-day to retain and $0.0035 per GiB scanned. Bundled query pricing lists $0.02 per GiB-day to retain with included queries.
- Real User Monitoring: $2.25 per 1,000 sessions.
- Synthetic Monitoring: $1.00 per 1,000 HTTP monitor requests and $4.50 per 1,000 browser monitor actions.
Dynatrace offers published list prices, but final quotes can differ because multi-year and volume-based discounts are available. The pricing page also points users to the Dynatrace Playground and sales team rather than a free-forever plan.
What Drives Your Real Dynatrace Bill
The real cost grows when several usage meters stack together:
- Host Size: Full-Stack Monitoring is billed by memory-GiB-hour, so larger hosts cost more for the same monitoring time.
- Host Count: Infrastructure Monitoring and Foundation & Discovery are billed by host-hour, so each monitored host adds to monthly usage.
- Log Volume: Log costs depend on ingest, retention and query usage, not just whether logs are enabled.
- Sessions and Synthetic Checks: Real User Monitoring and Synthetic Monitoring add separate costs as traffic, checks and browser actions grow.
- Enabled Capabilities: Dynatrace Platform Subscription draws down your committed budget as different capabilities are used.
That is the issue for incident-comms teams. Dynatrace pricing is tied to consumption across infrastructure, telemetry, digital experience, and other enabled capabilities.
Instatus: A Focused Alternative for Incident Communication
Instatus gives teams the incident communication layer without turning every outage workflow into an observability cost center. Keep Dynatrace for deep production diagnostics, and use Instatus when the job is simply monitoring key services, notifying the right people, and keeping customers updated from a branded status page.
Instatus Pricing
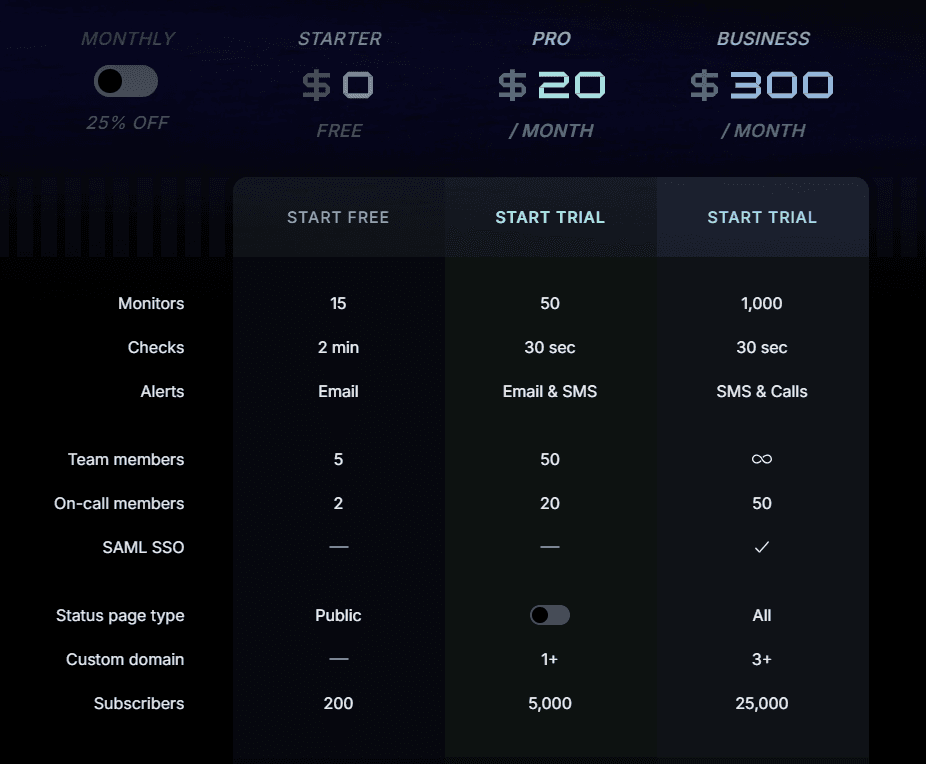
Instatus uses flat monthly plans, so teams can plan monitoring, alerts, on-call and status pages without telemetry-based charges. Yearly billing gives you 25% off.
- Starter, $0/month: 15 monitors, 2-minute checks, email alerts, 5 team members, 2 on-call members, a public status page and 200 subscribers.
- Pro, $20/month: 50 monitors, 30-second checks, email and SMS alerts, 50 team members, 20 on-call members, 1+ custom domain and 5,000 subscribers.
- Business, $300/month: 1,000 monitors, 30-second checks, SMS and call alerts, 50 on-call members, SAML SSO, all status page types, 3+ custom domains and 25,000 subscribers.
- Enterprise, Custom Pricing: SCIM directory sync, priority support, 99.99% uptime SLA, multiple SSO connections, custom contracts and custom policies.
Why Teams Choose Instatus for Incident Communication
Instatus helps teams monitor services, alert responders and update customers from one place. It runs website and API checks from global locations every 30 seconds, with alerts for downtime, slow responses or wrong content.
Alerts work through email, SMS, Slack, Discord, Microsoft Teams, phone calls, webhooks and push notifications. Teams can manage incidents from the dashboard, Slack or Microsoft Teams, then use public, private or select-audience status pages to reduce duplicate support tickets.
Instatus vs. Dynatrace
For incident communication, Instatus covers the full workflow on one predictable bill.
| Capability | Dynatrace | Instatus |
|---|---|---|
| Uptime monitoring | Synthetic Monitoring and NAM | Included |
| HTTP, API, ping, DNS, TCP, SSL and keyword checks | HTTP, browser, ICMP, TCP and DNS monitoring | Included |
| Check frequency | Configurable | 30 seconds on paid plans |
| Status pages | Not a dedicated status page product | Public, private and select-audience pages |
| Alert channels | Alerts and integrations | Email, SMS, calls, Slack, Discord and Microsoft Teams |
| Pricing model | Usage based across hosts, memory, logs, sessions and synthetics | Flat plans |
| Free tier | Free trial | Free Starter plan |
Use Instatus for Your Incident Communication
Dynatrace is worth it when you need deep observability. But if the daily job is uptime monitoring, alerts and customer updates, Instatus gives you that workflow on a simpler flat plan.
Start free with Instatus and get your status page, monitoring and incident response workflow ready before the next outage.

Get ready for downtime
Monitor your services
Fix incidents with your team
Share your status with customers