
Datadog vs Dynatrace: Which Monitoring Tool Is Right for Your Team?

Quick Summary
Datadog suits teams that want broad integrations and a flexible, usage-based pricing model. Dynatrace wins on AI-driven root cause detection and deep APM for enterprise environments. Neither tool includes a customer-facing status page. That gap is where Instatus comes in.
How We Looked at These Tools
The Datadog vs Dynatrace decision comes up constantly for engineering teams building out their observability stack. Both are powerful and expensive at scale, and they cover a lot of the same ground: APM, infrastructure monitoring, log management, and real user monitoring. The differences live in the details: how they charge, how much manual configuration they require, and how smart the alerting actually is in practice.
What most comparisons skip is the part that comes after the alert fires. Your engineering team knows there's a problem. But what do your customers know? Both Datadog and Dynatrace are built for internal visibility. Neither gives you a way to proactively tell customers what's happening or keep them updated while your team works the incident. That workflow gap is worth naming before you decide.
Here's an honest look at all three tools, including what each one does well and where each one falls short.
Why Listen to Us
At Instatus, we build status pages and incident communication software used by teams at Deno, Harvard, Wistia, Railway, and Modern Treasury. We work directly alongside monitoring tools like Datadog and Dynatrace in production incident workflows every day. That gives us a specific, ground-level view of where these tools complement each other and where they leave teams without coverage. This guide reflects that practical context, not vendor marketing.
Datadog vs Dynatrace: Key Differences
APM depth
Dynatrace's PurePath tracing reaches the method level automatically, no additional instrumentation needed. Datadog APM requires a per-language SDK setup on top of the base agent and delivers service-level visibility by default.
Setup and Service Discovery
Dynatrace's OneAgent discovers your entire tech stack from a single install. Datadog requires per-integration configuration, typically via YAML config files, giving you more granular control.
Incident Management and Alerting
Datadog has a more developed incident response module with on-call workflows. Dynatrace groups related problems using Davis AI, reducing alert noise significantly, but has no dedicated incident management workflow. Neither platform closes the loop with customers.
What is Datadog?
Datadog is a cloud monitoring and observability platform that unifies infrastructure monitoring, APM, log management, real user monitoring, and security in a single interface. With over 1000 native integrations covering AWS, Azure, GCP, Kubernetes, and most major databases, it serves as a single pane of glass for most cloud environments.
The product is genuinely comprehensive. If you want to correlate a log spike with a latency issue tied to a specific deployment, Datadog lets you do that in one view without switching platforms. Teams routinely stand up production-ready dashboards within 15 minutes of getting the agent installed, and the alerting integrations with Slack and PagerDuty are mature and well-documented.
The tradeoff is billing complexity. Datadog charges per host, per GB of log ingestion, per custom metric, and separately for each product module. Each unique tag combination counts as a separate billable custom metric, a detail that catches teams off guard. Enabling the AWS integration by default auto-ingests all CloudWatch metrics, inflating custom metric counts fast. At scale, Datadog costs can approach or match infrastructure costs. Active cost governance isn't optional.
Features
- Unified observability: Correlates logs, APM traces, infrastructure metrics, and RUM across one interface for full-stack visibility.
- Broad integration library: One of the widest in the market, covering infrastructure, CI/CD, databases, alerting tools, and cloud providers.
- Customizable dashboards: Flexible visualization options including line, bar, timeseries, and heat map charts.
- APM with distributed tracing: Service-level trace analysis with flame graphs, latency percentiles, and error tracking across languages.
- Incident management module: On-call scheduling, automated escalation policies, and triage workflows built into the platform.
Pricing
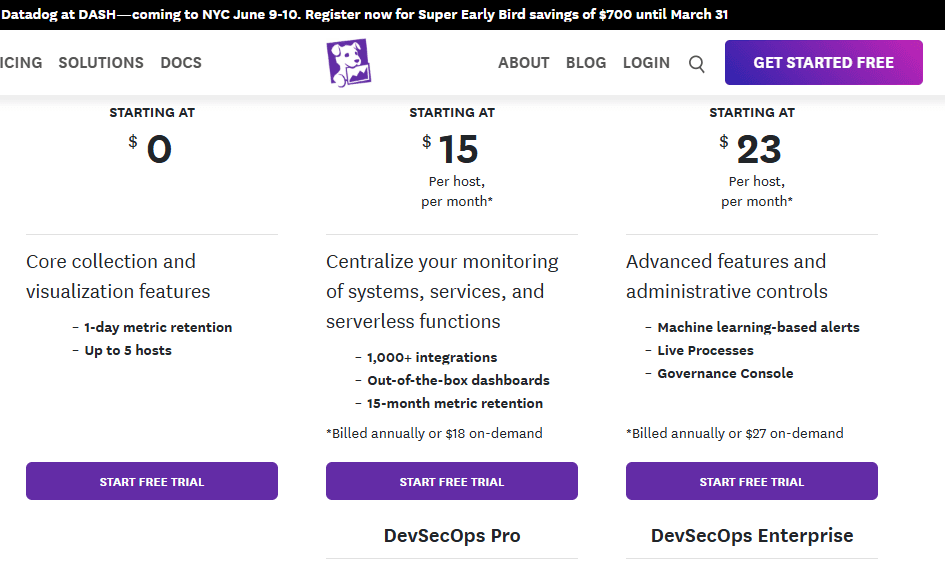
Infrastructure monitoring starts at $15/host/month. APM starts at $31/host/month, or $36 on-demand. Log management is billed per GB ingested plus per GB indexed. Custom metrics add additional cost. Annual billing required for best rates.
Pros
- One of the widest integration libraries in the market
- Mature on-call and incident management module
- Fast agent installation; production visibility achievable within an hour
- Excellent learning center with interactive labs
Cons
- Billing is multi-dimensional and regularly produces surprise invoices at scale
- Custom metric costs compound quickly in tag-heavy environments
- No customer-facing status page
- Support can be slow for complex technical issues
What is Dynatrace?
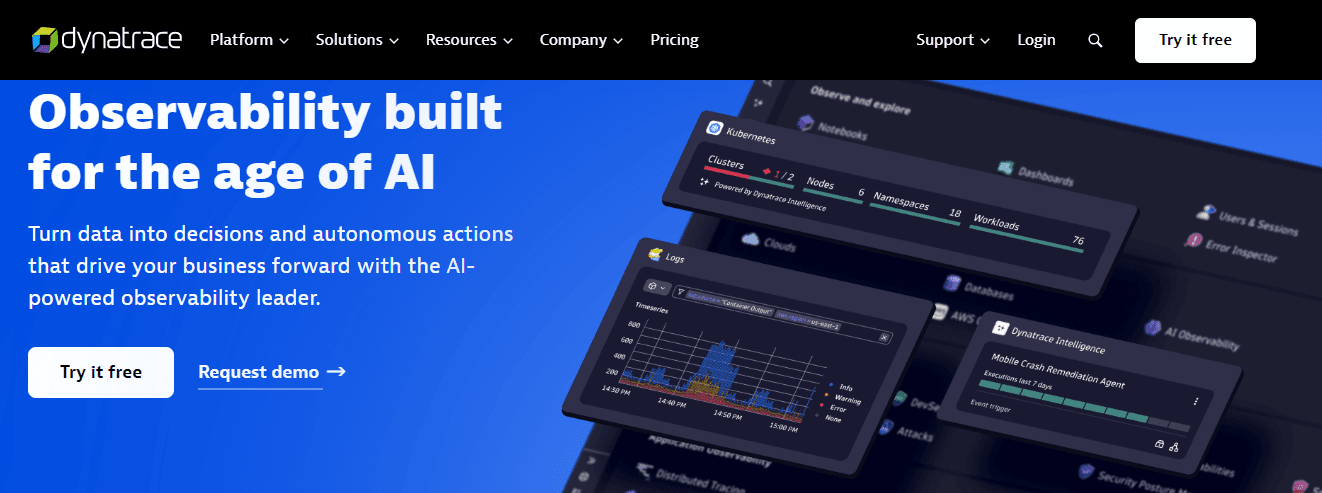
Dynatrace is a full-stack observability and AIOps platform built for large, complex distributed systems. Its core differentiator is Davis AI, an autonomous root cause detection engine that groups related alerts into a single problem card and identifies the specific component responsible, without engineers manually correlating signals across dashboards.
In practice, this matters. Dynatrace can detect a problem, trace it to a specific database query introduced in a recent deployment, and surface that finding before most teams have assembled a response. For organizations where MTTR has a direct revenue impact, that speed justifies the cost. OneAgent also discovers your entire application topology (servers, apps, database calls, dependencies) from a single install command. A working service map appears within minutes.
Cost is the defining constraint for most teams evaluating Dynatrace. Pricing uses a DPS (Dynatrace Platform Subscription) model that is consumption-based with hourly billing per capability. OneAgent's auto-collection defaults are comprehensive, which means it ingests substantial data by default and you're billed for all of it.
The defaults are generous with your data budget. Small and mid-size teams regularly find the value doesn't justify the spend at their scale, while enterprise teams with complex distributed systems often find it irreplaceable.
Key Features
- Davis AI root cause analysis: Automatically groups related alerts into a single problem with the specific root cause identified, dramatically reducing alert fatigue.
- OneAgent auto-discovery: Single agent deployment discovers your full application topology, including services, databases, and infrastructure dependencies, without additional configuration.
- PurePath distributed tracing: Method-level tracing across the full transaction lifecycle from browser click to database query.
- Smartscape topology map: Live, automatically maintained map of service dependencies showing how changes propagate across your environment.
- RUM with business impact correlation: Links user experience metrics like session completion rates directly to business outcomes like revenue and conversion.
Pricing
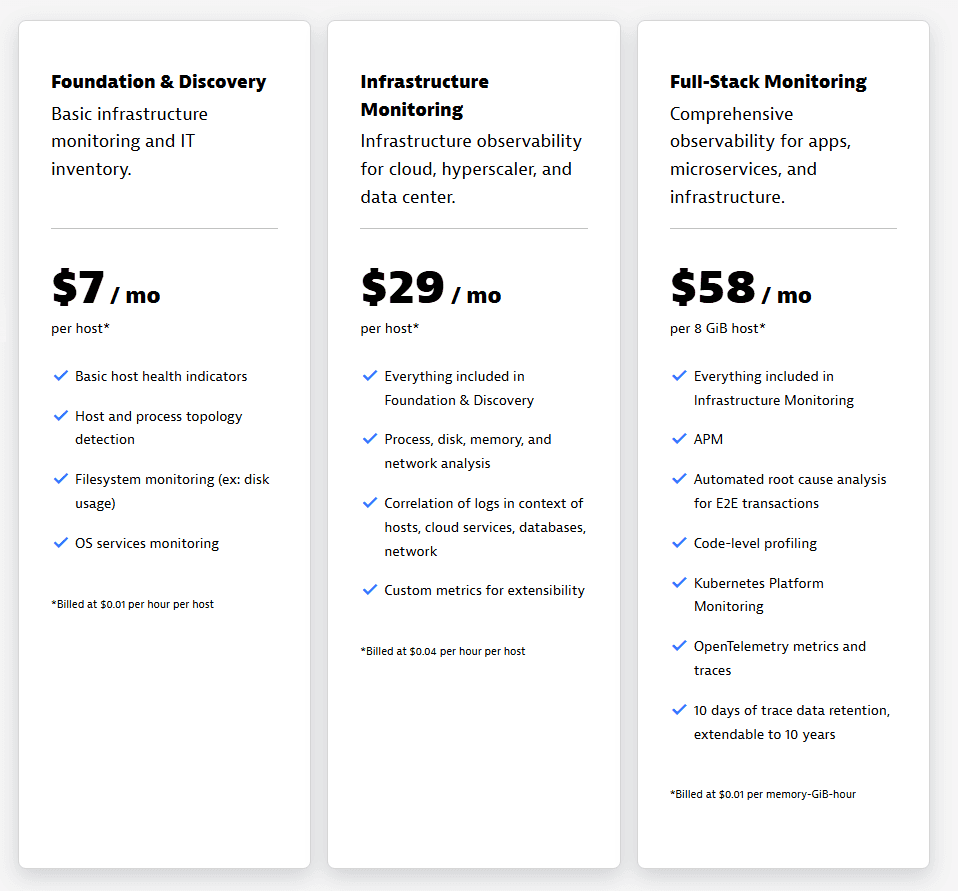
Pricing is publicly listed. Foundation & Discovery starts at $7/mo per host, Infrastructure Monitoring at $29/mo per host, and Full-Stack Monitoring at $58/mo per 8 GiB host. Volume discounts are available but require a sales conversation. No free tier.
Pros
- Davis AI is widely regarded as best-in-class for autonomous root cause detection
- OneAgent discovery is fast and comprehensive with minimal manual setup
- PurePath is consistently cited as one of the deepest APM implementations available
- Strong for enterprise hybrid and multi-cloud environments
Cons
- Public rate card exists, but volume discounts require a sales conversation
- Auto-collection defaults can drive high costs if not actively managed
- No customer-facing status page
- Steep learning curve once past initial setup
Instatus: Best Alternative to Datadog and Dynatrace for Incident Communication

Instatus is a status page and incident communication platform that sits alongside your monitoring tools to handle the customer-facing side of any incident. Where Datadog and Dynatrace tell your engineering team what broke, we tell your customers what's happening until it's resolved.
We've been running since 2020 and are actively used by teams at Railway, Deno, Modern Treasury, and others who run Datadog or Dynatrace for observability and Instatus to communicate outward. The two workflows are complementary, not competitive.
Our pages are delivered as static files via CDN, which means the status page stays accessible even when your primary infrastructure is down. If your status page runs on the same stack as the service that just failed, it fails too. A dynamic status page during a database outage is useless to customers who need to know what's happening.
The free plan is genuinely useful. You get 200 subscribers, custom HTML and CSS, webhooks, and a full API. These are features most status page tools lock behind paid tiers. Users report evaluating and setting up the platform in under an hour.
On integrations, Instatus connects directly to Datadog, Pingdom, UptimeRobot, Site24x7, and 10+ other monitoring tools, so status updates fire automatically when your monitoring detects a problem. See the full integrations library for everything that's supported. Slack-driven incident updates are also supported natively, a capability most status page tools still don't offer.
Features
- Monitoring integrations: Connects to Datadog, Pingdom, Site24x7, UptimeRobot, and 10+ other tools to automate status updates.
- CDN-delivered static pages: Status page stays live during infrastructure outages, rendering independently of your backend.
- Subscriber notifications: Customers subscribe for updates via email, SMS, Slack, MS Teams, or webhook. 200 subscribers on the free plan, 5,000 on Pro, and 25,000 on Business.
- Custom branding and domain: Full custom CSS, HTML, and JavaScript on the free plan; custom domain from $20/month.
- Incident templates and maintenance scheduling: Pre-built templates speed up communication; maintenance windows are communicated to subscribers in advance.
- Embeddable status widget: Drops into your app or website to show real-time status without redirecting users to a separate page.
Pricing

The free plan includes 200 subscribers, 15 monitors, and custom CSS. Pro is $20/month for a custom domain. Business plans up to $300/month include SSO, multiple status pages, and advanced access controls. Annual billing saves 25%.
Pros
- Free plan is functional with no features artificially locked behind paid tiers
- Static CDN delivery keeps the page up during exactly the moments customers need it
- Generous team and subscriber limits across all plans, with unlimited team members on Business
- Connects natively to Datadog; API and webhook support for Dynatrace with minimal setup
Cons
- Bulk component editing is clunky for teams managing many services
- Incident history visualization is minimal compared to richer alternatives
- Native uptime monitoring is limited; works best paired with a dedicated monitoring tool
- Email notifications send from Instatus's domain by default unless you configure a custom email provider
Datadog vs. Dynatrace vs. Instatus: Feature Comparison
| Instatus | Datadog | Dynatrace | |
|---|---|---|---|
| Customer-facing status page | Yes | No | No |
| Subscriber notifications | Yes (up to 25,000 on Business) | No | No |
| Full-stack APM | No | Yes | Yes (deepest) |
| AI root cause detection | No | Watchdog RCA (requires APM, less autonomous than Davis) | Yes (Davis) |
| Free plan | Yes (functional) | Limited (5 hosts) | No |
| Pricing transparency | Yes (public) | Partial | Public rate card, volume discounts require negotiation |
| Monitoring integrations | 10+ (inbound) | 1000+ | Broad (auto) |
Why Do People Choose Instatus?
Completes the Incident Workflow
Monitoring tools and status pages solve different problems for different audiences. Datadog and Dynatrace answer the question your engineers are asking: what's broken, where, and why. A status page answers the question your customers are asking: Is this affecting me, and when will it be fixed? During a major incident, engineering works on the fix while customers check your website, open support tickets, and post on social media. Without an official communication channel, the noise compounds.
Works with Your Existing Monitoring Stack
Teams running Datadog can automate status page updates directly from a monitor trigger using the Datadog integration. For Dynatrace teams, the same automation is achievable through the Dynatrace webhook setup with a one-time configuration. The monitoring tool detects, and the status page communicates. Neither workflow replaces the other.
Builds Trust Before Anything Breaks
A public uptime history signals transparency to potential customers and enterprise buyers. Teams like Deno and Wistia use it as part of a broader reliability story, not just for incident response. When customers can see your historical uptime before anything breaks, the conversation during an outage starts from a position of established trust rather than from zero.
Take Control of Incident Communication with Instatus
If you're choosing between Datadog and Dynatrace, the decision comes down to scale and priorities. Dynatrace is the stronger choice for large enterprises that want Davis AI doing triage automatically. Datadog is the stronger choice for teams that need maximum integration flexibility and can actively manage billing.
What both tools leave uncovered is customer communication. If your team is running either platform without a status page, that missing layer directly affects how incidents land with customers.
Start with our free plan and connect it to whatever monitoring tool you're already running. Setup takes about 30 minutes, and your first subscriber notification can go out before your next incident hits. Get started at instatus.com.

Get ready for downtime
Monitor your services
Fix incidents with your team
Share your status with customers