
Top Monitoring Tools for DevOps for Every Need

There is no DevOps without continuous monitoring.
Continuous monitoring is a vital part of the continuous improvement tenant of DevOps and can’t be overlooked. But how do you choose a continuous monitoring tool where there are so many options to choose from?
Continue reading for a breakdown of the key purposes of continuous monitoring and how it can help your organization build a better software product for your customers. We’ll cover the 7 best continuous monitoring tools for DevOps and introduce you to great accessory tools like Instatus.
DevOps and Monitoring
DevOps is a culture of work with a focus on collaboration and continuous improvement. It hinges on the idea that you can make high-quality, stable software applications by combining the expertise of the development and operations team in a collaborative way.
Active continuous monitoring is key to success if your team operates under this methodology. Your software is supported by many systems, services, pieces of hardware, network connections, devices, and dependencies that work together to deliver an excellent product to your customers.
The work of your Dev and Ops teams is never done. But how can you tell when your systems are in trouble? How does your IT know when your systems have been compromised? How does your Dev team know when a bug has cropped up, and it’s plaguing the experience of your users?
The answer is continuous monitoring. Continuous monitoring supports the goals of DevOps by catching incidents early, so they are addressed promptly, helping your Dev team to continually improve the performance of their application, reducing downtime to improve reliability, and creating a top-tier user experience.
Continuous monitoring can revolutionize your Ops approach, handling security risks early and offering visibility over the entire application environment.
Why is Monitoring a Must?
With continuous monitoring, your teams will have more visibility over all application systems and services. Otherwise, you’re left in the dark, issues may linger, and that’s not an acceptable way to operate. Let’s look at some of the reasons continuous monitoring is a vital part of any successful DevOps application:
Catch Incidents Early
What’s the point of an incident management plan without the data to know when there’s an incident to respond to? That’s where continuous monitoring comes in. Continuous monitoring allows team members, particularly those on call, to immediately respond to any notification of cyberattacks or other security risks, service outages, and application instabilities.
Rapid response is essential for gaining and keeping the trust of your users. Recurring incidents where your team is slow to respond can hurt your reputation and encourage users to switch to a different product. You can’t have an incident response team without the data to know when to respond?
Consider adding additional tools to enhance your continuous monitoring. Integrations like Pager Duty help you automate the notification process, so the right people are notified when serious incidents or disruptions of your application are detected.
Continuous Improvement
Long-term monitoring reveals vital information about the application, including logs, user reports, and incident reports. Leverage this data to build improvements and fix issues for your application. You miss all that performance, network, and infrastructure data without monitoring.
Instead of using an evidence-based approach, you’d be randomly stabbing in the dark when deciding which features or issues to tackle next. When consumers are having problems with a particular service, your team needs to know about it as soon as possible to roll out a bug fix on the fly.
Minimizing the number of users that are impacted by a performance inconvenience and other application issues is essential to a happy user base.
Downtime and Reliability
What is your company's tolerance for downtime? Probably very minimal. What is your MTBF, and when was your last outage? If your team is trying to continually improve reliability (and they should as a DevOps organization), then continuous monitoring data is the best way to do that.
Learning what systems are under the most stress or security risk helps Ops teams develop solutions to address these issues early and prevent a critical outage. Handle performance issues, like low memory and latency, as they develop to encourage a higher-quality experience for your users.
User Experience
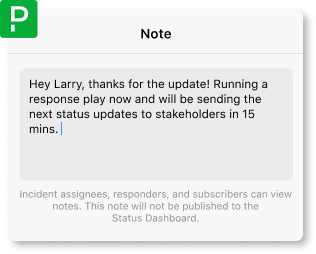
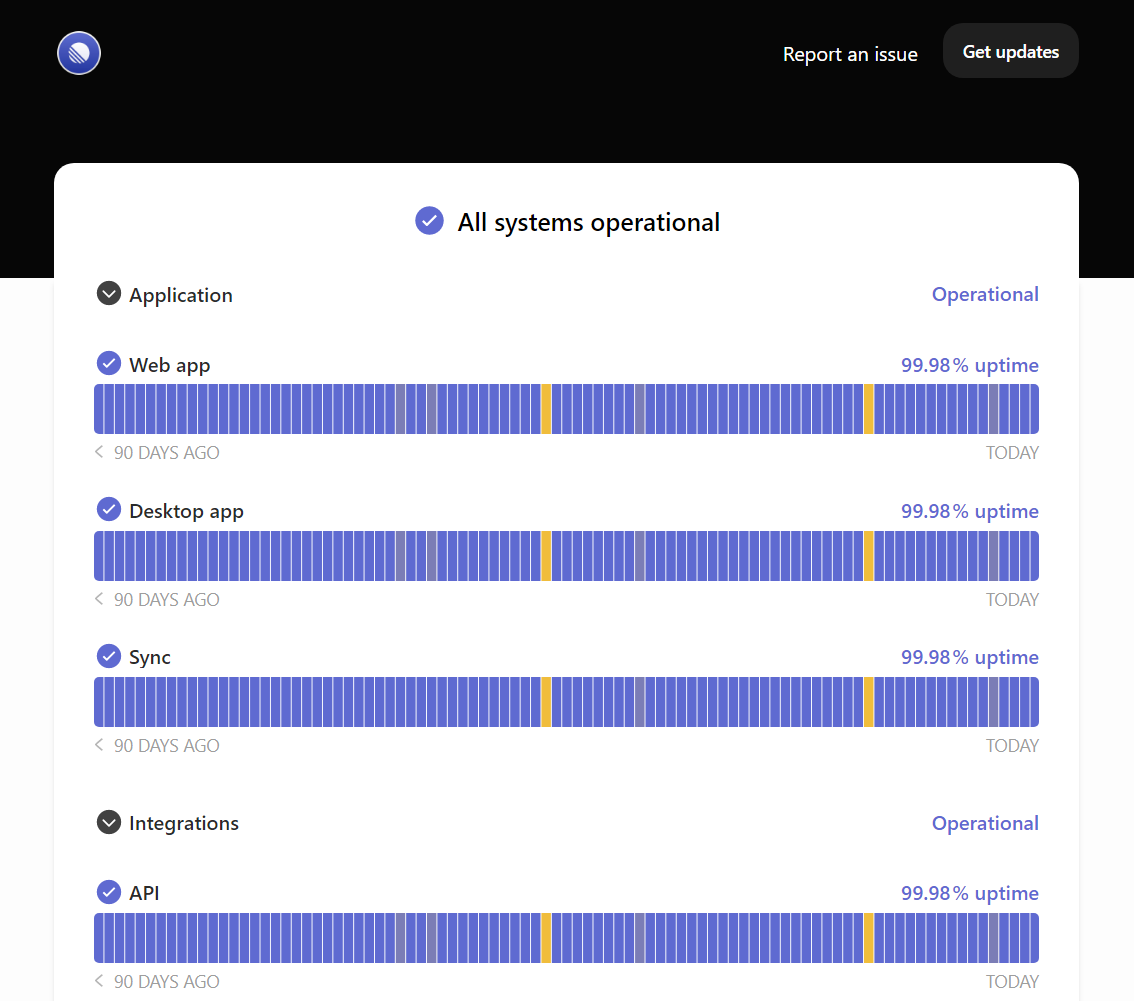
One component of continuous monitoring that often gets overlooked is the user experience. Leverage the full power of continuous monitoring and use the data on a status page. With a status page like those offered by Instatus, you can keep your users in the loop.
A status page displays the status of your application and associated services. Your team can provide updates on the issues, ongoing troubleshooting, and an estimated service restoration time. Instatus also acts as a way to show your customers how stable your product is with your high uptime.
Instastus offers three pricing tiers. The free tier, the Pro tier for $20 a month, and the business tier at $300 a month. Every tier includes unlimited team members and subscribers so that no matter how large your company grows, there is no additional charge to support team members and subscribers.
With competitive pricing and unlimited subscribers and teammates, Instatus stands far above leading competitor Statuspage. If you’re interested in seeing more examples of Instatus’ beautiful yet functional pages, check out their user gallery.
Breakdown of Continuous Monitoring
Most organizations need to monitor four key areas continuously, to keep a close eye on all aspects of their software application. These four areas are outlined below:
1. Application Monitoring
Application monitoring tools usually provide a central dashboard for an overview of application performance, updates, and alerts to bring attention to any issues. You can configure these tools to alert your team once certain thresholds are met.
The focus of application monitoring is providing developers with the ability to track bugs, performance changes, and other facets of user experience. Better track the performance of your dependencies to understand bottlenecks and other cascading failures.
2. Network Monitoring
Network monitoring tools help your IT teams track the many components of your servers and systems for any issues that need to be addressed. Most of these tools will monitor your networks automatically and notify on-call personnel when a significant event occurs.
With network monitoring, you’ll be able to see the live status of all network devices. Network monitoring is especially vital to improve your application's overall reliability and uptime.
3. Infrastructure Monitoring
The larger your organization, the more infrastructure components are needed to run your systems. Keeping track of the health and status of these components can quickly become too difficult to manage without infrastructure monitoring tools.
You’ll be able to monitor both on-site and cloud infrastructure with any infrastructure monitoring tool worth its salt. Monitor hardware data, including disk space, memory usage, CPU usage, and CPU temperatures, to ensure that your hardware is functioning without issue.
4. Security Monitoring
Security monitoring is sometimes underrepresented in DevOps monitoring tools because of the complexities involved. Usually, an organization will choose software specifically tailored to handle the security side of things. But continuous monitoring solutions with security features help to provide extra support in this critical area.
Top DevOps Monitoring Tools
There’s a multitude of monitoring tools for DevOps available on the market. But not all monitoring tools are created equally. You’ll want to carefully consider the costs and benefits of each option to find the best fit for your organization’s needs. But to get you started on that journey, we’ve compiled a list of the top DevOps monitoring tools:
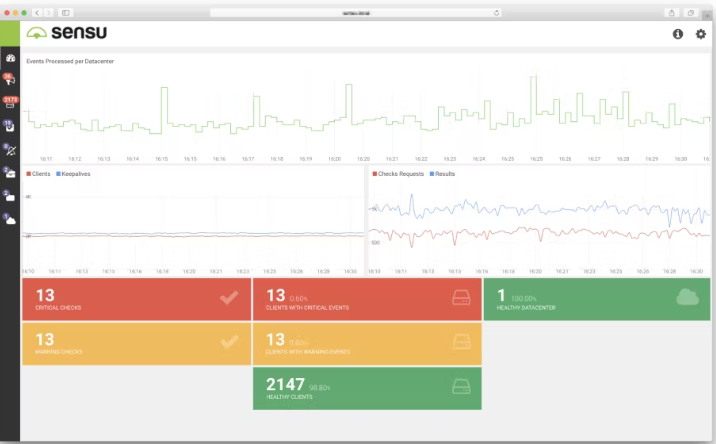
1. Sensu
Sensu is a cloud-based monitoring tool for DevOps environments. It has a dedicated API and is designed to monitor large-scale dynamic systems by setting thresholds for thousands of metrics. Empower your team to better manage their multi-cloud environments in an automated fashion. Sensu delivers excellent visibility for all cloud systems and protocols, including Kubernetes. Sensu has an extensive list of available integrations covering third-party monitoring tools, incident management tools, web and automation platforms, cloud platforms, and data tools.
Sensu is available for free for small organizations requiring less than 100 nodes. Larger organizations can choose between Sensu Go Pro at $3 per month per node (nodes capped at 3000) or Sensu Go Enterprise at $5 per month per node with unlimited nodes.
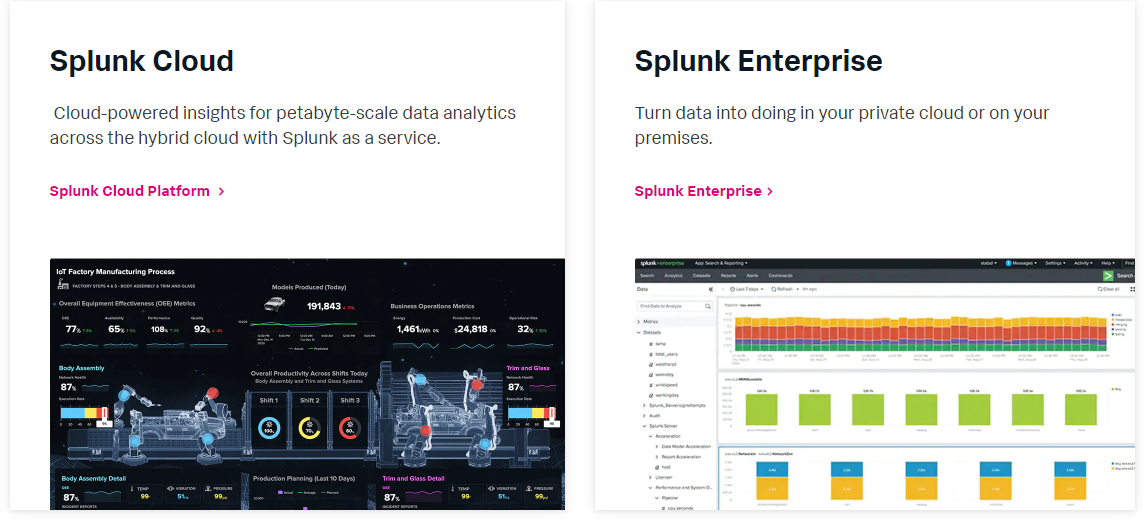
2. Splunk
Splunk is a continuous monitoring platform that is customizable and highly scalable, with a focus on security and observability. Splunk is an excellent option used by many well-known companies, including Nasdaq, Heinekin, Honda, Aflac, and Tesco.
Gain access to over 2,400 community-built apps or use Splunk’s built-in solutions. With Splunk your team will have ‘end-to-end visibility’ of all environments plus access to metrics, logs, and traces. Choose between their two primary products, Splunk Cloud or Splunk Enterprise.
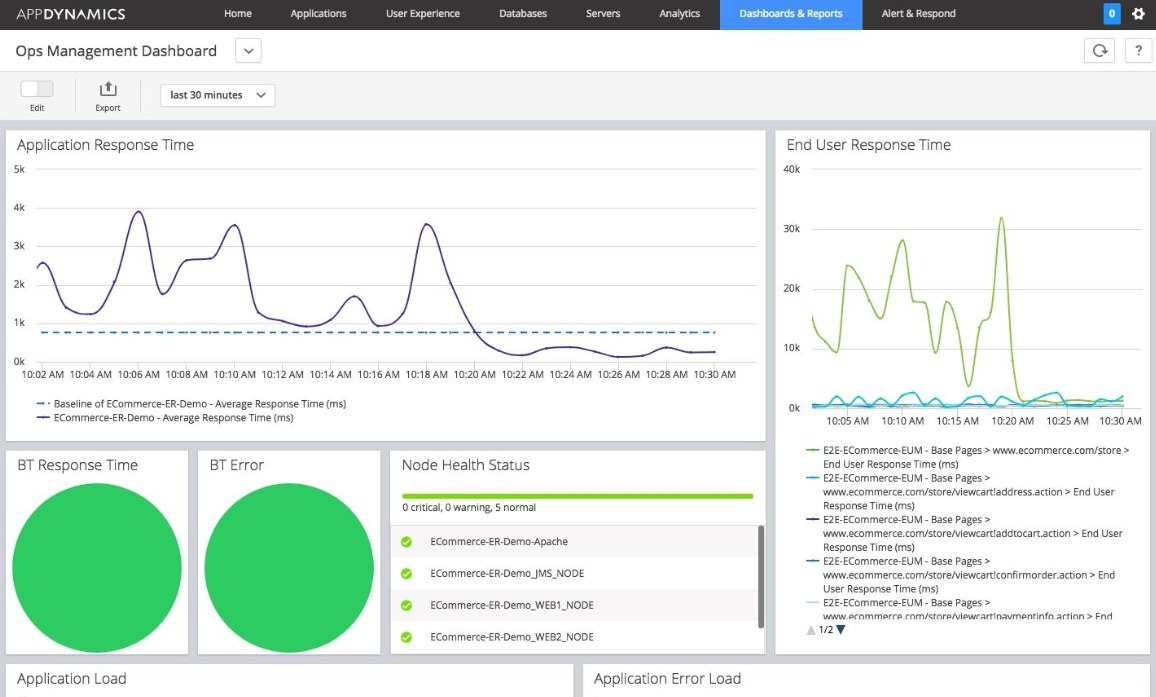
3. AppDynamics
AppDynamics is an all-in-one continuous monitoring solution that handles business performance, user experience, application, network, infrastructure, and security monitoring.
AppDynamics helps solve your performance challenges by improving visibility and making intelligent suggestions. AppDynamics can monitor your servers, cloud environments, microservices, and everything in between.
AppDynamics offers three service tiers: the Infrastructure Monitoring Edition, Premium Edition, and Enterprise Edition. The first focuses on infrastructure diagnostics and the second on backend monitoring. The third option, the Enterprise Edition, includes both components of the lower tiers plus user experience monitoring to deliver a complete picture of your application at all times.
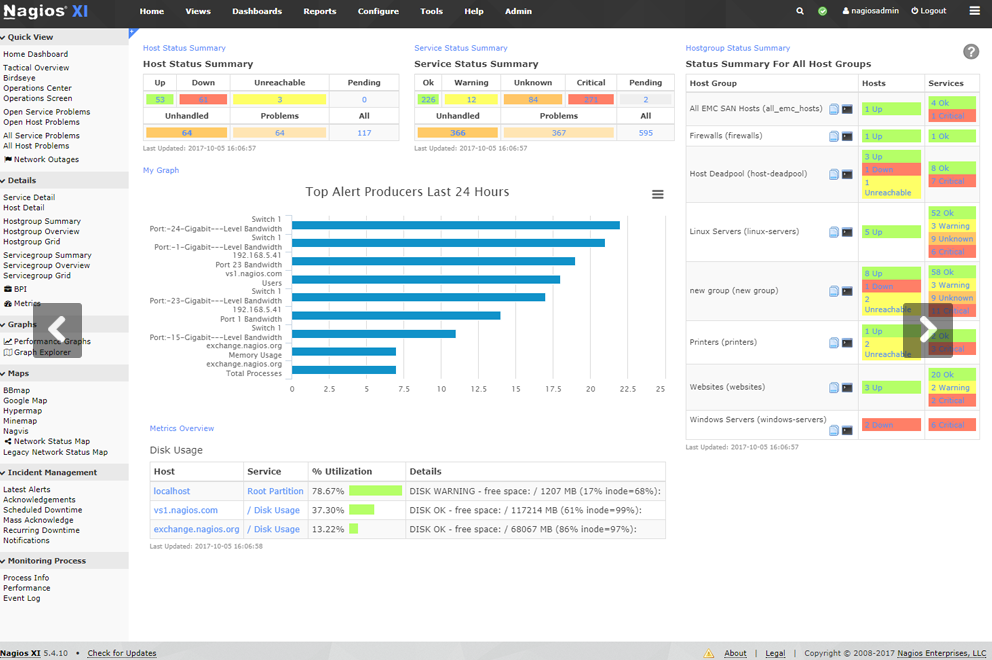
4. Nagios
Are you looking for a continuous monitoring solution for IT infrastructure? Then Nagios might be the right solution for your organization. Nagios monitors your networks and checks the status of your hardware devices like switches and routers. Nagios customers gain access to over 5000 addons built for monitoring servers and alerting for concerning events. You can prevent downtime by closely monitoring your application's service and process problems.
Nagios is a free and open-source solution making it an excellent option for smaller organizations with limited budgets.
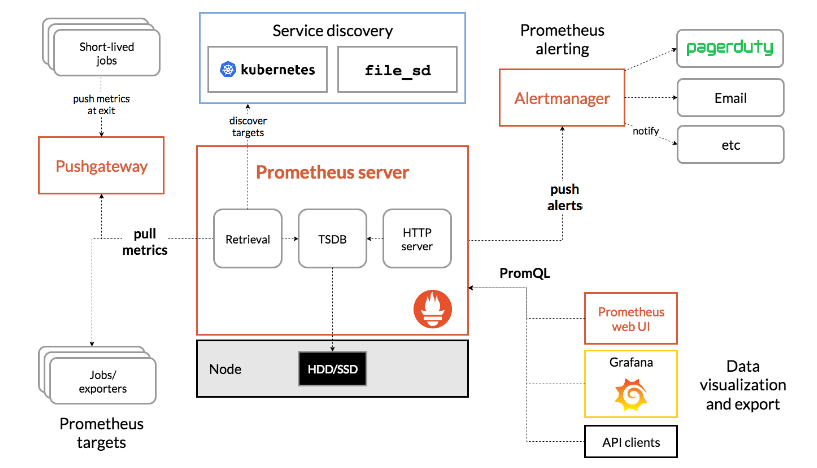
5. Prometheus
Prometheus is an open-source monitoring toolkit. Select Prometheus to have access to a large community of developers. Prometheus has multiple components that work in tandem to keep an eye on your systems, including an alert manager and the primary Prometheus server. The main goal of Prometheus is to improve your application’s reliability by scraping metrics and providing real-time alerts. Prometheus can be combined with visualization tools like Grafana.
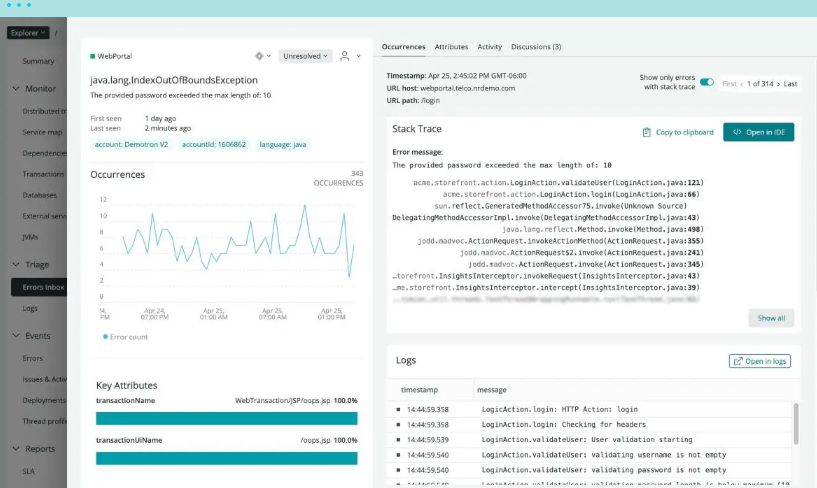
6. New Relic
A full-stack monitoring solution like New Relic fits the needs of most DevOps organizations. New Relic combines 16 monitoring tools into a single platform with one monthly price. New Relic reveals errors without any complicated configuration. New Relic’s machine learning algorithms detect patterns in log messages to create smart alerts. Proactively identify issues affecting user experiences, so your team can react promptly.
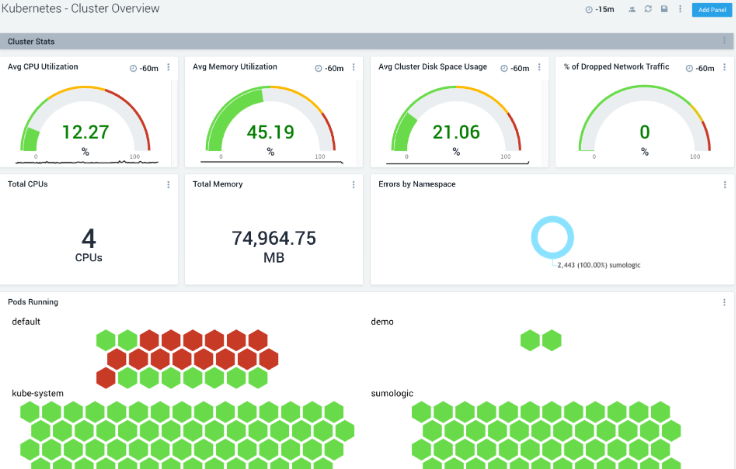
7. Sumo Logic
Sumo Logic’s suite of monitoring tools allows your organization to mix and match tools. Each tool listed below is available for individual pricing, so you can customize your monthly costs to meet your needs:
- Cloud Log Management
- Infrastructure Monitoring
- Application Observability
- Software Development Optimization
- Audit and Compliance
- Cloud Security Monitoring and Analytics
- Cloud SIEM
- Cloud SOAR
With Sumo Logic, the complex systems are distilled into actionable insights, so you can easily manage customer-facing application issues. Keep your logs de-siloed and in a single accessible location to improve troubleshooting and reduce the risk of security risks.
8. Zabbix
Zabbix is a comprehensive open-source monitoring solution that includes devops server monitoring tools. It offers a wide range of features and capabilities, including network and server monitoring, cloud and container monitoring, and integration with external ITSM, helpdesk, and messaging systems.
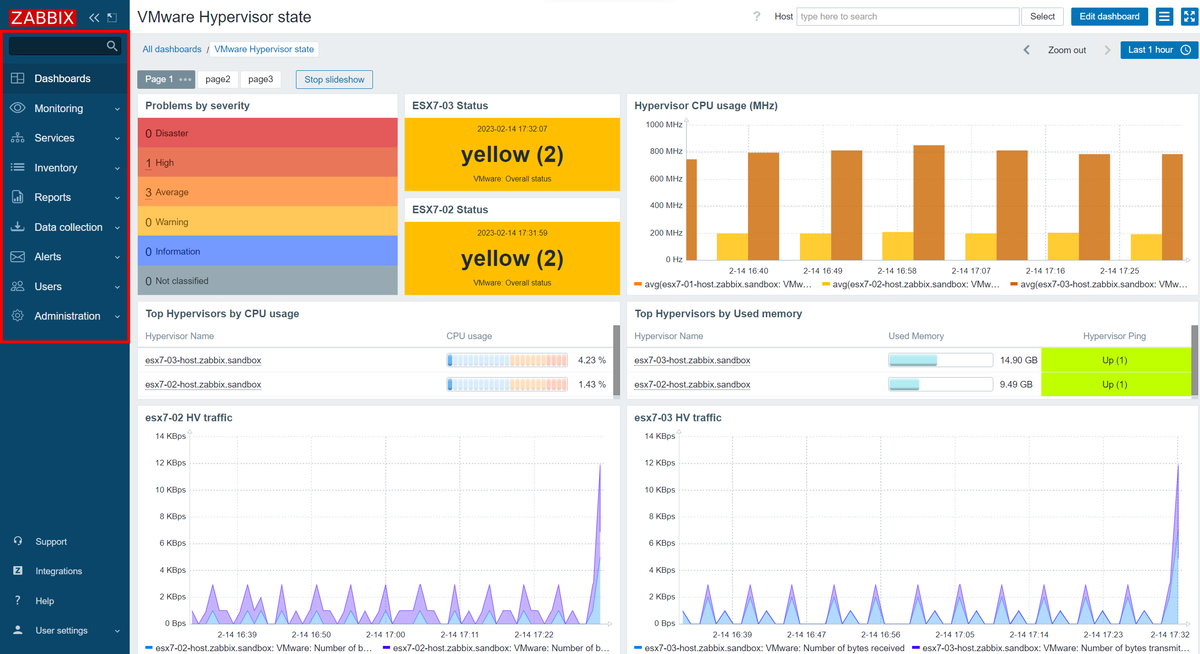
With Zabbix, you can visualize and track the status of your infrastructure, create customized dashboards, and receive reports and audits. It also provides scalability, high availability, and security features to meet your monitoring needs. Zabbix is available for download and offers support, training, and services to ensure efficient and secure monitoring of your IT infrastructure.
9. Grafana
Grafana is an open-source platform used for data visualization, monitoring, and analytics. It allows you to query, visualize, and alert on different types of data from various sources. Grafana offers a range of solutions, including logging with Grafana Loki, tracing with Grafana Tempo, and metrics with Grafana Mimir and Prometheus. It also provides plugins to connect to different data sources and applications.
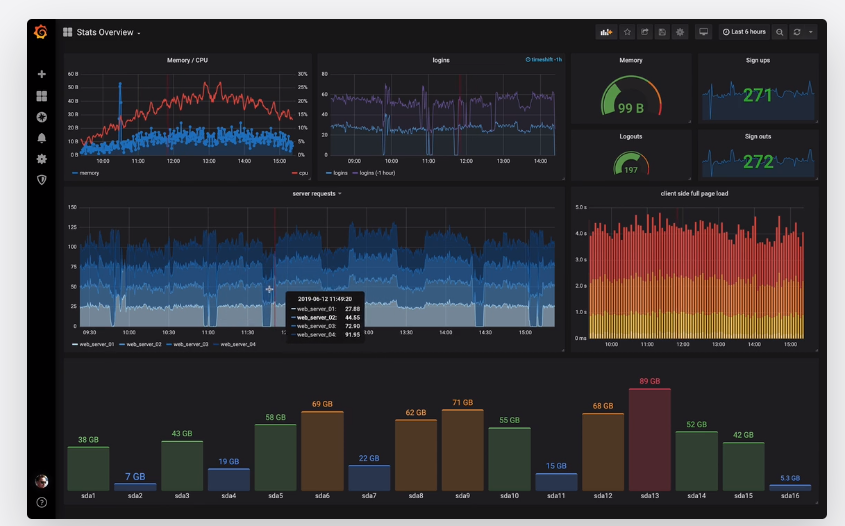
Grafana can be deployed on-premises using Grafana Enterprise or as a fully managed service with Grafana Cloud. It offers a free forever plan with certain limitations and also provides paid options with additional features. Grafana has a strong community support and offers resources like documentation, webinars, tutorials, and community forums.
10. InfluxDB
InfluxDB is a popular choice among devops server monitoring tools. It. is a purpose-built database that allows you to run real-time apps and generate insights from any time series data. It offers fast storage compression, faster queries against high-cardinality data, and improved ingest performance.
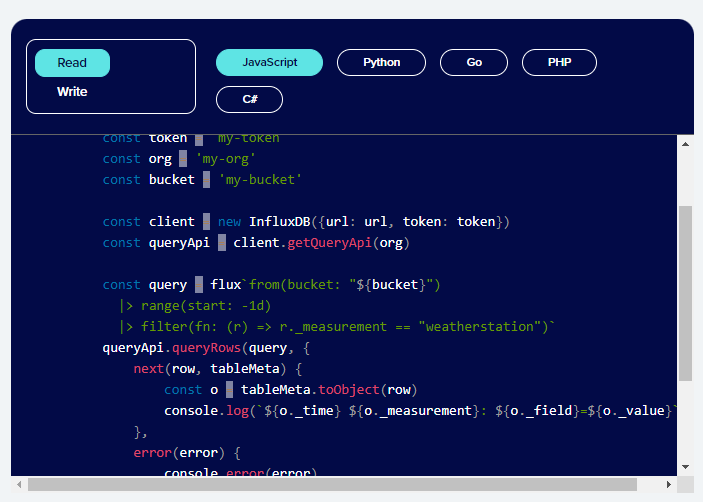
InfluxDB 3.0 features include a single datastore for all time series data, native SQL support, low latency queries, unlimited cardinality, and interoperability with data ecosystems. You can use it with various programming languages such as JavaScript, Python, Go, PHP, and C#. InfluxDB is among trusted devops server monitoring tools from startups to enterprises and has been praised for its speed, real-time capabilities, and ease of use.
11. Monit
Monit is a small open-source utility designed for managing and monitoring Unix systems. It offers automatic maintenance and repair capabilities, as well as the ability to take meaningful actions in error situations. Monit can monitor various aspects of a system, including processes, files, directories, filesystems, network connections, programs, scripts, and general system resources. It can proactively respond to error situations, such as restarting a service that is not running or stopping/restarting a resource-consuming process.
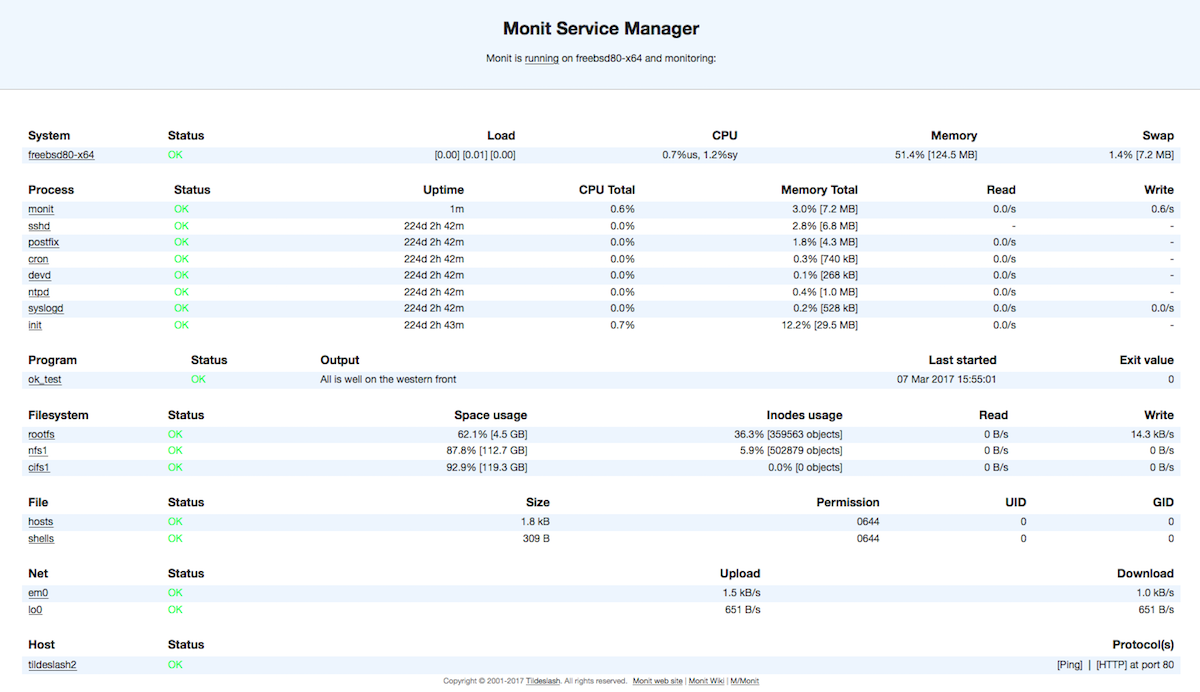
Monit is designed to be non-intrusive and easy to use, integrating with existing system infrastructure. It is compatible with most flavors of Unix and is lightweight in terms of resource usage. Monit provides documentation, a manual, FAQs, and a wiki for user support and information. It is an open-source project, and users are welcome to contribute and report bugs. Monit is licensed under the GNU Affero General Public License (AGPL). Additionally, there is an option to use M/Monit for managing multiple Monit servers, offering expanded capabilities and a user-friendly interface.
12. Sysdig Monitor
Sysdig Monitor is a product offered by Sysdig that provides comprehensive devops monitoring tools. It allows users to gain deep visibility into their containerized applications, Kubernetes clusters, and cloud infrastructure.
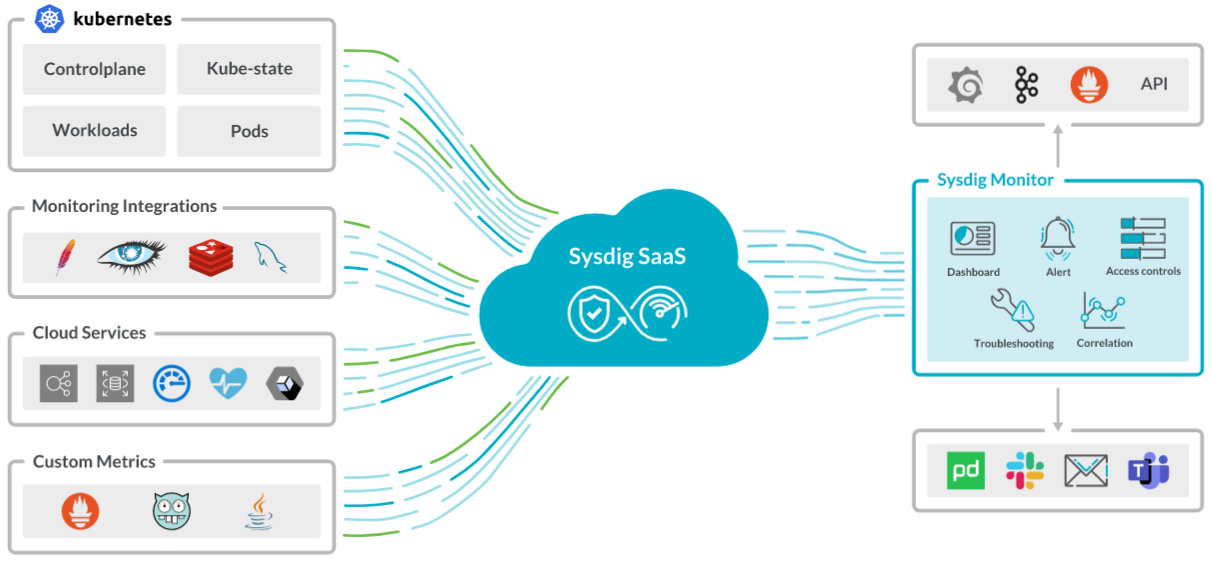
With Sysdig Monitor, users can troubleshoot Kubernetes errors faster by accessing a prioritized list of issues, pod details, live logs, and remediation steps. It also offers simplified and scalable Prometheus integration, allowing users to leverage out-of-the-box dashboards and alerts. Additionally, Sysdig Monitor helps optimize costs by reducing wasted spending and providing low-cost custom metrics.
Overall, Sysdig Monitor enables users to enhance application availability, performance, and problem resolution in their containerized and cloud-native environments.
Picking the Best Fit
Continuous monitoring is an essential component of your success as a DevOps organization. To continually improve your application, you must first understand how your application is performing. Continuous monitoring also helps your Ops team stay aware of your network health and infrastructure status 24/7. Use the data collected by continuous monitoring tools to troubleshoot ongoing issues to prevent downtime and avoid outages like never before.
The top 7 monitoring tools for DevOps include Sensu, Splunk, AppDynamics, Nagios, Prometheus, New Relic, and Sumo Logic. Each monitoring solution has advantages covering a wide range of use cases and budgets. Don’t forget to include integrations and accessory tools like Instatus to ensure your customers are always briefed on the status of your application in a beautiful but simplified format.

Get ready for downtime
Monitor your services
Fix incidents with your team
Share your status with customers