
Our top 8 Site24x7 Alternatives
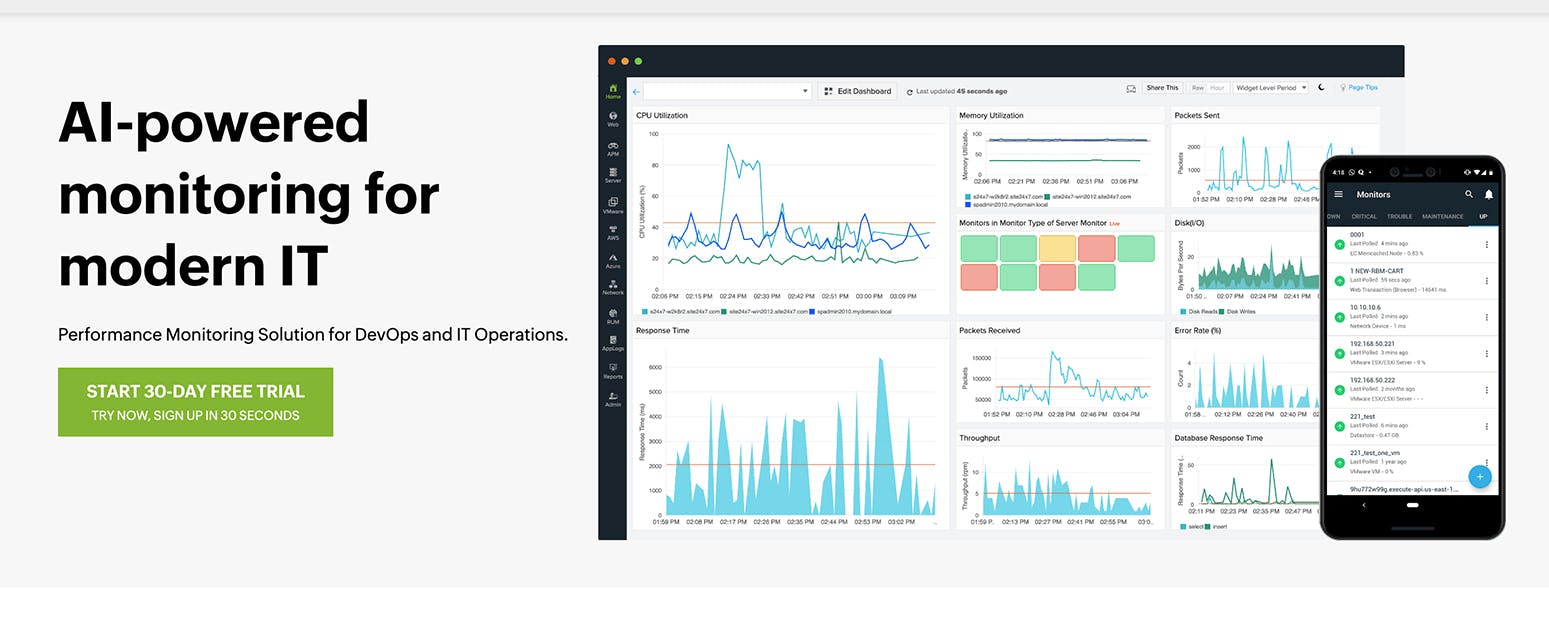
Site24x7 offers an all-in-one monitoring solution covering the monitoring of websites, servers, clouds, networks, applications, and real users.
It provides deep visibility into critical performance parameters of resources. However, no single tool can cater to all unique needs and scenarios. That’s why it’s important to explore alternatives to Site24x7 that might offer different features or better align with your specific requirements.
This Instatus guide aims to introduce you to some of the most noteworthy alternatives to Site24x7, helping you navigate the myriad options available today.
Let’s dive in.
What is Site24x7?
Site24x7 is a comprehensive monitoring solution that allows DevOps and IT operations to manage and troubleshoot applications, servers, and network infrastructure, including private and public clouds. It provides deep visibility into the performance of critical resources.
The main features of Site24x7 include:
- Website Monitoring
- Server Monitoring
- Application Performance Monitoring
- Network Monitoring
- Cloud Monitoring
- Real User Monitoring (RUM)
- Log Management
Why Look for Site24x7 Alternatives?
Complex User Interface
Users have reported that the interface has a steep learning curve, making it difficult for new users to navigate and utilize the platform’s full capabilities.
Lack of Features
Some users have found that it lacks certain features they require. This could range from specific types of monitoring to integrations with other tools.
Unreliable Performance
Some users have reported issues with the performance of Site24x7. These can include false alarms or missed alerts, leading to unnecessary panic or undetected issues.
Criteria to Consider When Choosing Site24x7 Alternatives
Features
The first thing to consider is whether the alternative offers the features you need. This could include specific types of monitoring, alerting capabilities, or integrations with other tools. Thoroughly evaluate what each tool provides and compare it with your requirements.
Ease of Implementation
Consider how easy it is to implement and use the tool. Some tools offer powerful features but have a steep learning curve. Others might be easier to use but lack advanced capabilities.
Reporting
The tool should be able to provide clear, detailed reports that help you understand your system’s performance.
8 Best Site24x7 Alternatives
Before we dive into the details, here’s the TLDR version:
- Instatus
- Dynatrace
- LogicMonitor
- Datadog
- AppDynamics
- New Relic
- Zabbix
- Pingdom
1. Instatus
Instatus offers powerful monitoring and incident management tools with simple, affordable status pages.
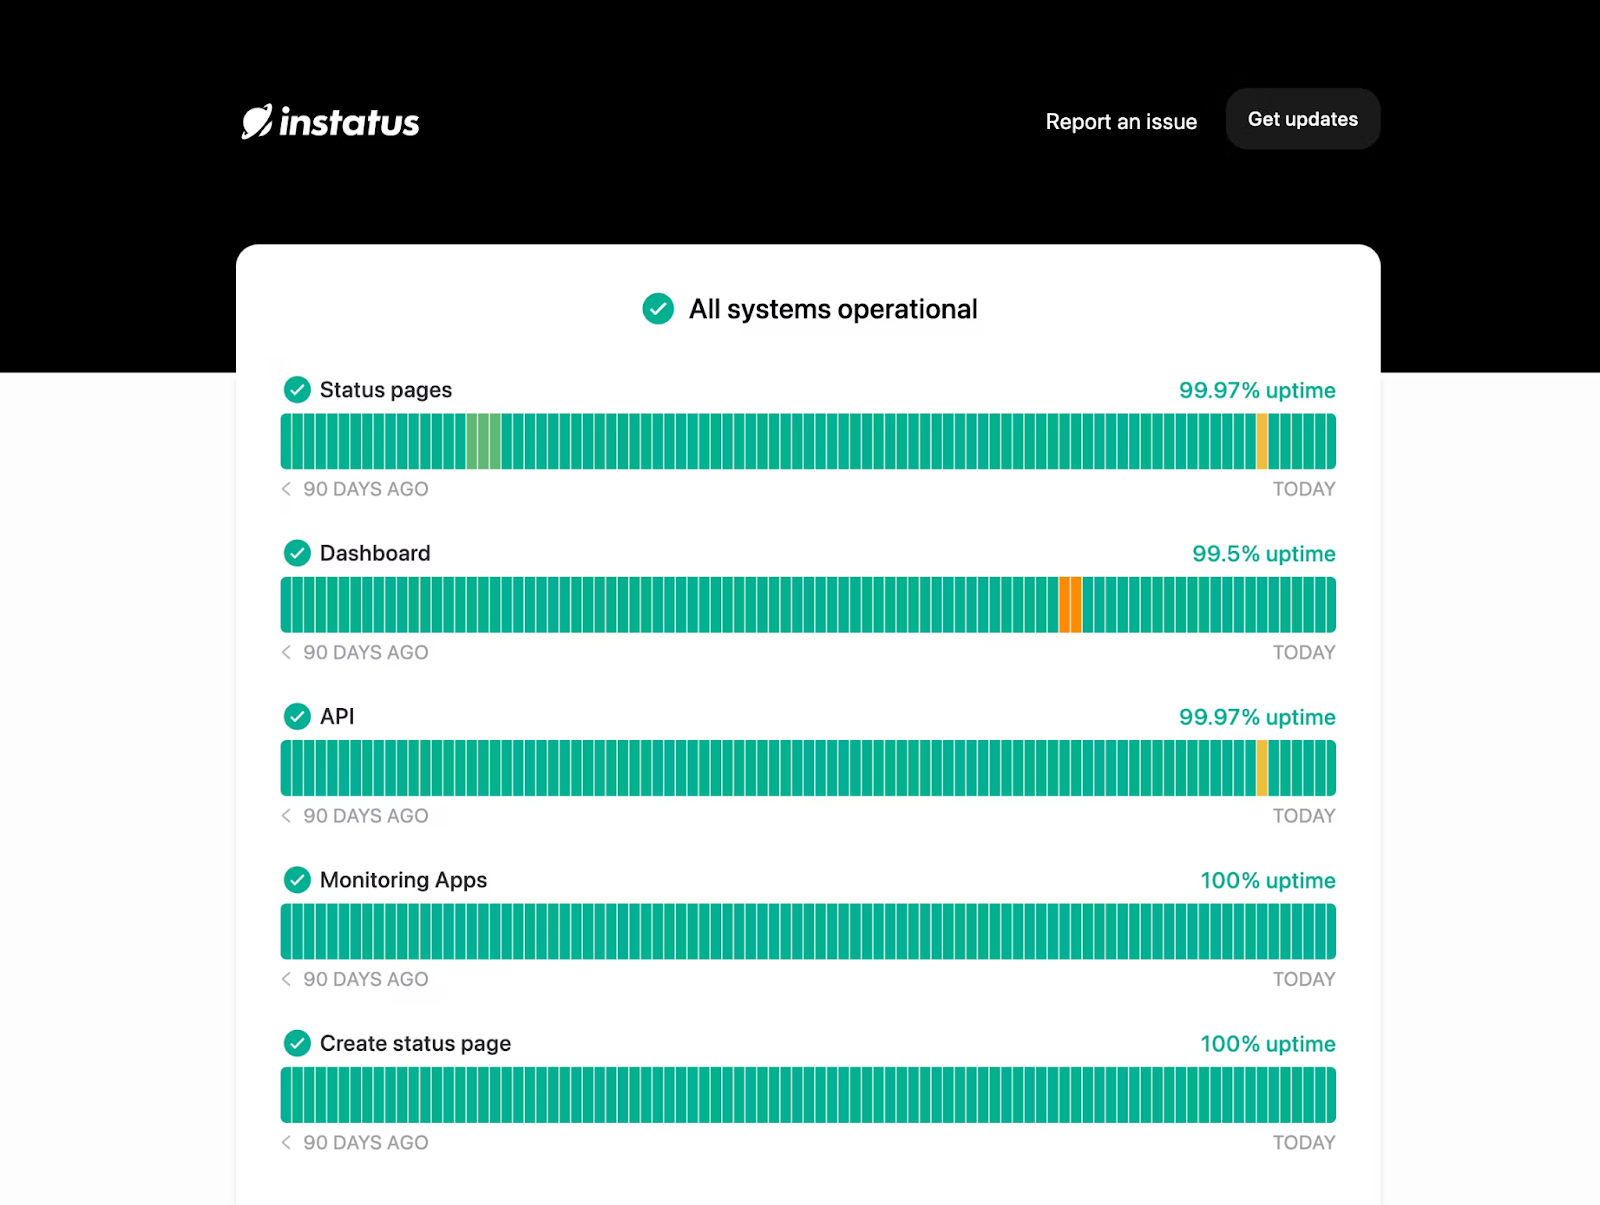
Instatus’s new monitoring features support a variety of monitoring types, including website, API, keyword, CRON, SSL, TCP, ping, and DNS monitoring. Rapid, 30-second checks make sure any outages are caught as quickly as possible, and collaborative incident management tools help ou get to work on fixes.
Your integrated public and private status pages help you communicate quickly and clearly with customers during an outage.
Relevant Features
- Monitoring Types: Keep tabs on websites and apps through website, API, keyword, CRON, SSL, TCP, ping, and DNS monitoring with 30-second checks from range of locations.
- Alerts: Get notified when issues occur with emails, SMSs, and calls, or integrate communication tools like Slack, Discord, and Teams.
- Integrated Status Page: Keep users and teammates updated about outages and maintenance with customizable public or private status pages.
- Monitoring Integrations: Link existing monitoring tools like Site24x7, Pingdom, and Datadog to keep tabs on all your systems.
- Customizable Design: Brand your status page with custom colors, logos, and domain to maintain customer trust. Play around with the CSS to create a page that matches your product.
- Incident Management: Create on-call calendars, set escalation and routing rules, manage incidents via Slack, add comments, and collaborate on solutions.
Pricing
Instatus has a free forever plan that allows for five monitors, 3-minute checks, email alerts, and a public status page supporting 200 subscribers.
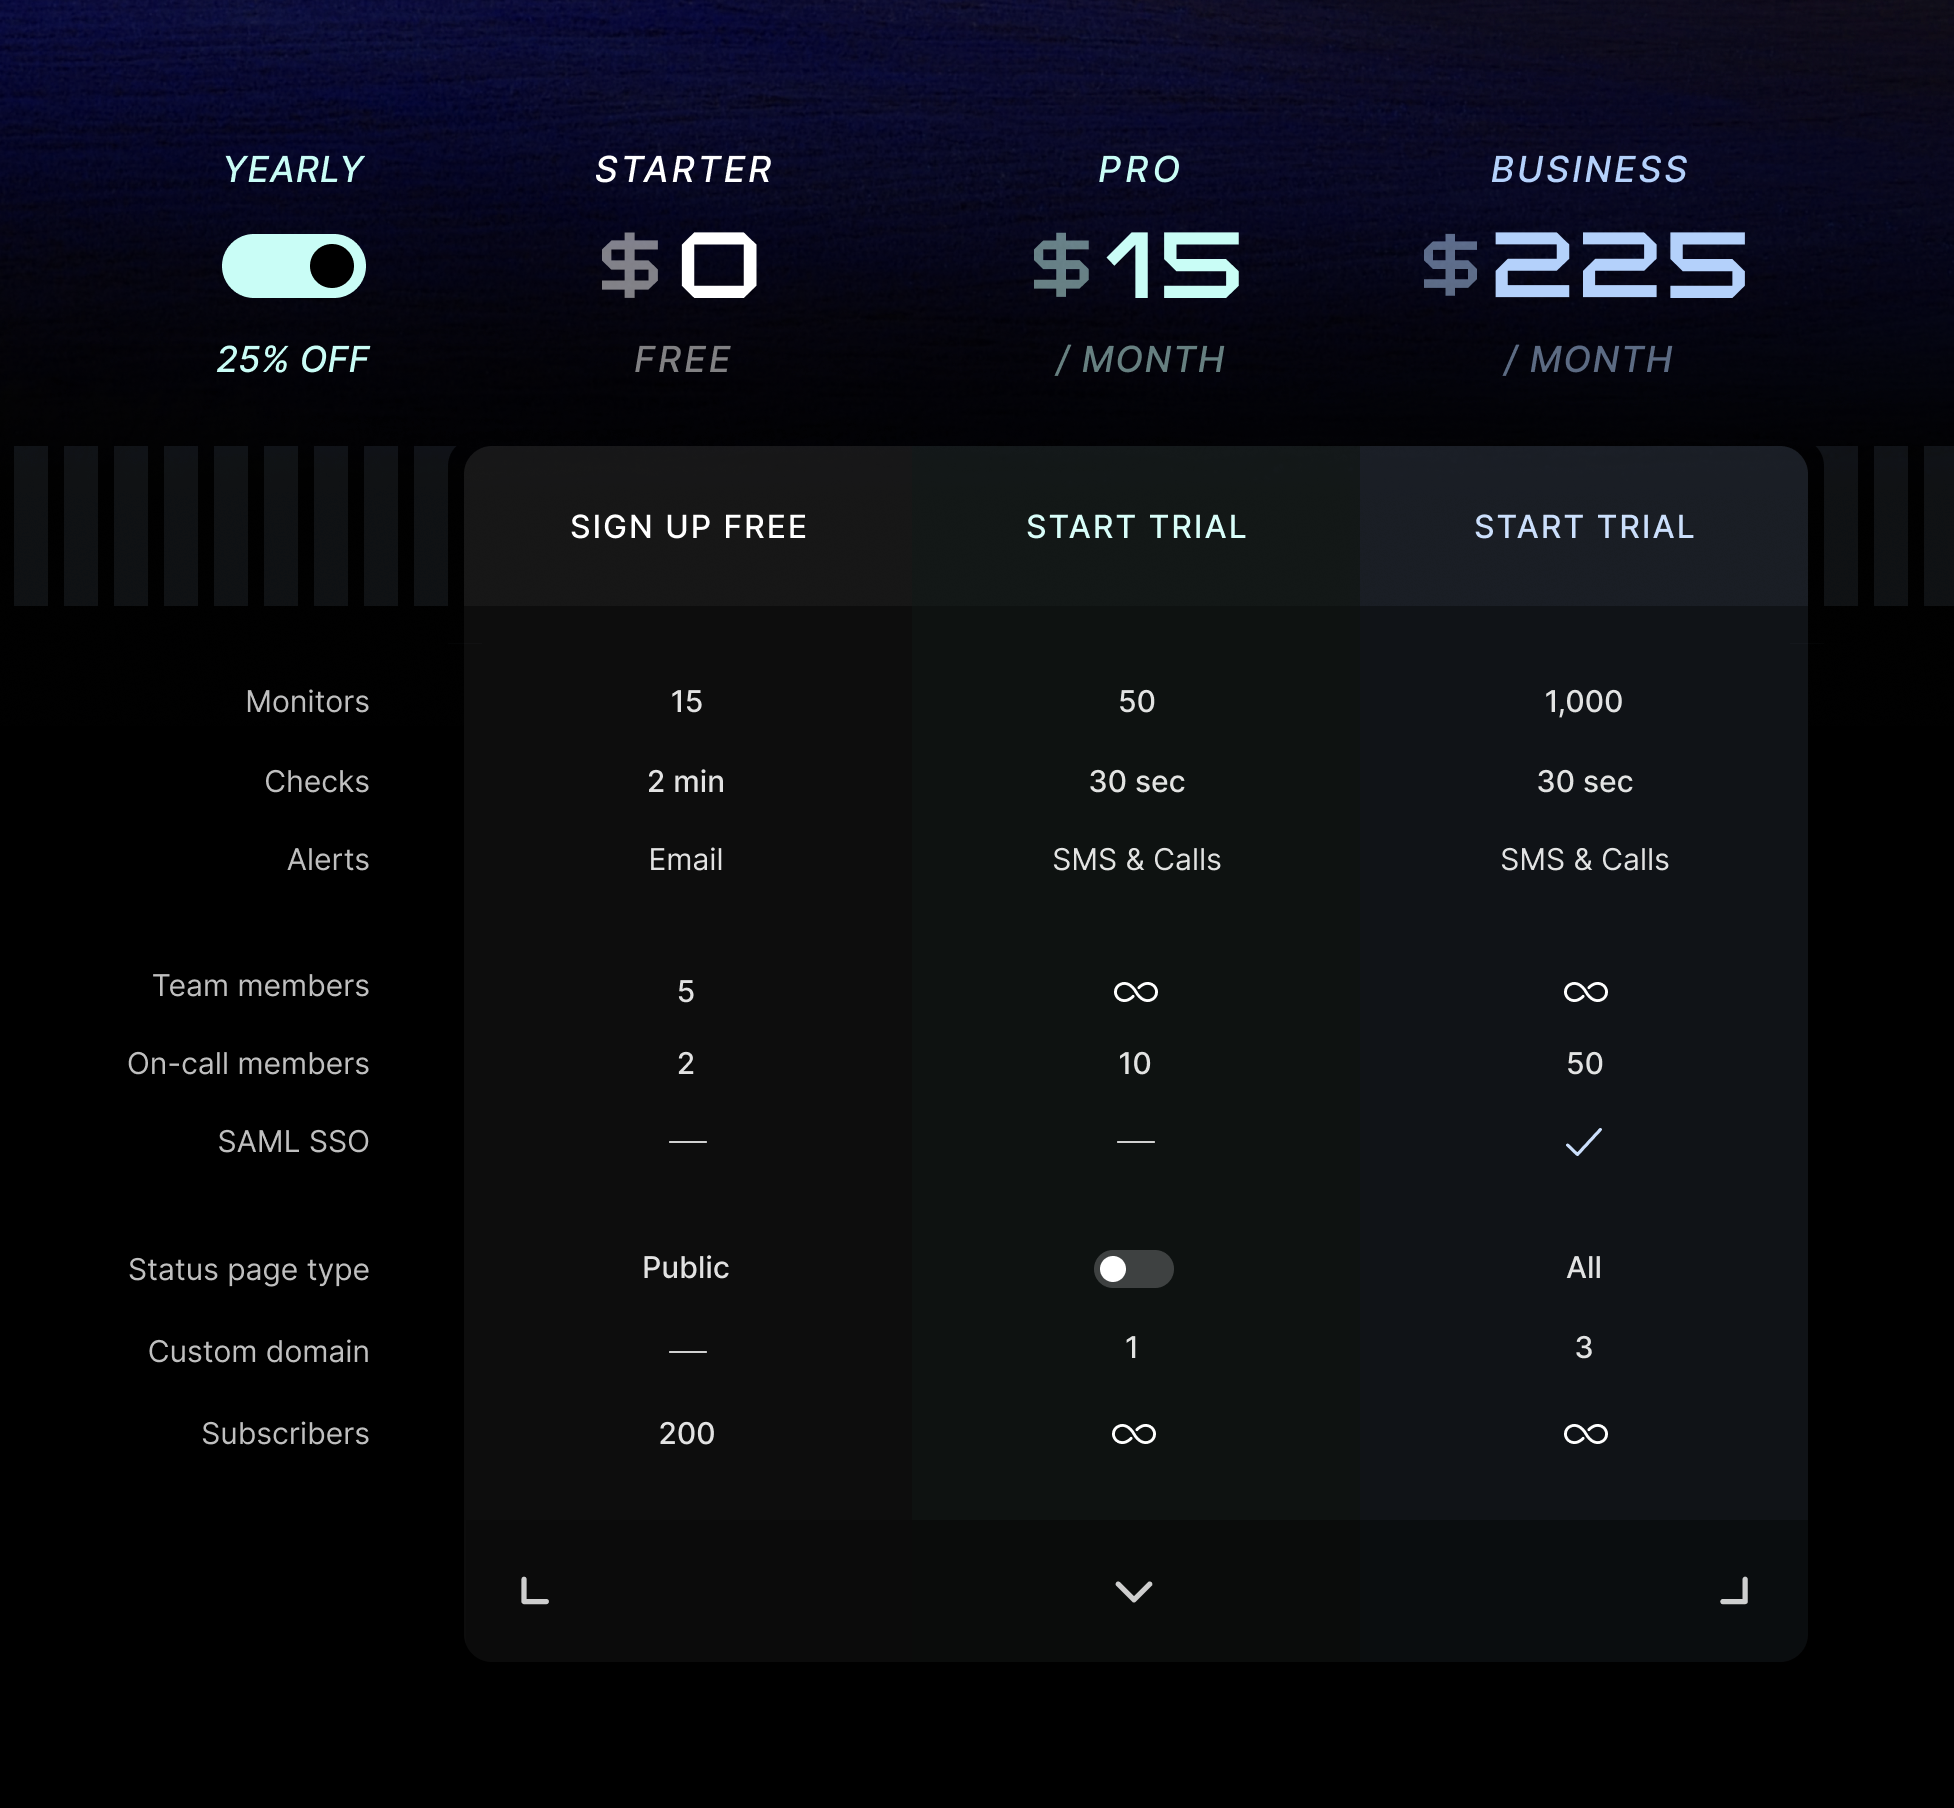
Pro ($15/month) allows for 50 monitors, 30-second checks, SMS and call alerts, as well as unlimited status page subscribers and teammates. Business ($225/month) adds SSO and raises the monitor limit to 1,000.
There’s also a custom Enterprise plan.
2. Dynatrace
Dynatrace offers unified observability and security solutions powered by a causality-detecting AI model that lets users simplify cloud complexity, innovate faster, and enhance security.
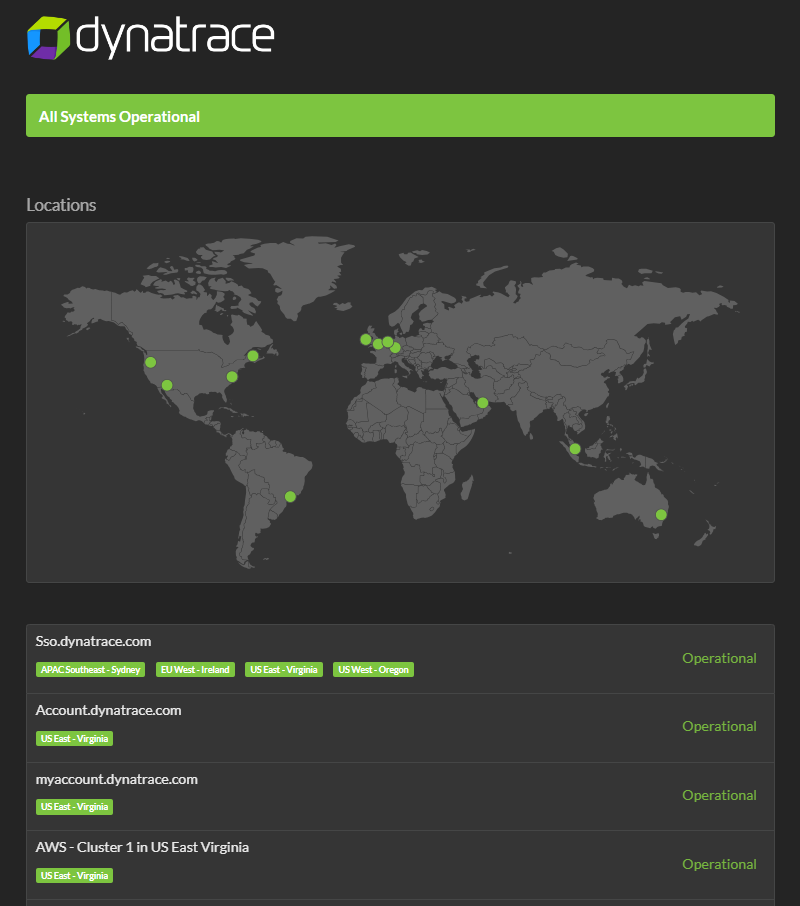
It provides complete visibility, precise answers, and automation capabilities to address digital challenges across infrastructure, applications, security, digital experience, business analytics, and more.
Relevant Features
-
Application Management: Manages and monitors applications for optimal performance and availability.
-
Automated Discovery: Automatically discovers and maps network devices, applications, and dependencies.
-
Baseline Manager: Establishes performance benchmarks for comparison and monitoring.
-
Root Cause Analysis: Identifies underlying causes of problems or incidents for effective resolution.
Pricing
Dynatrace offers a flexible pricing model where customers commit to an annual spend and pay based on their usage.
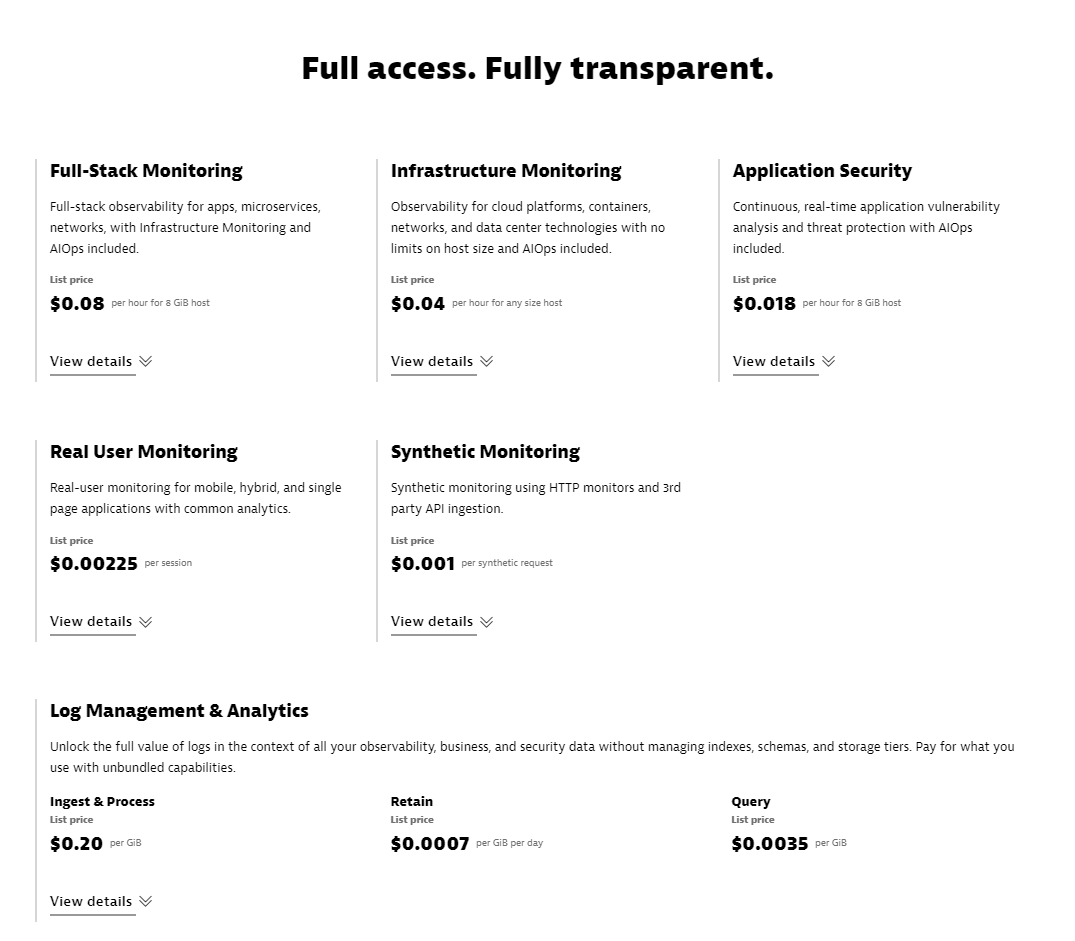
Pricing is based on usage (e.g., data ingested, data retained, etc.), and the rate depends on the product(s) you use. For example, Full-Stack Monitoring costs $0.08/hour/host.
Pros
- Alerting mechanism works well
- Flexible and easy to adopt
- 24/7 monitoring of infrastructure and applications
- Anomaly detection and automatic baselining
Cons
- Performance issues with some versions
- Pricing can be high
- Documentation could be more detailed
Rating
7.9 out of 10 reviews
3. LogicMonitor
LogicMonitor is a cloud-based and fully automated infrastructure monitoring platform that offers advanced features for monitoring infrastructure, applications, and business services.
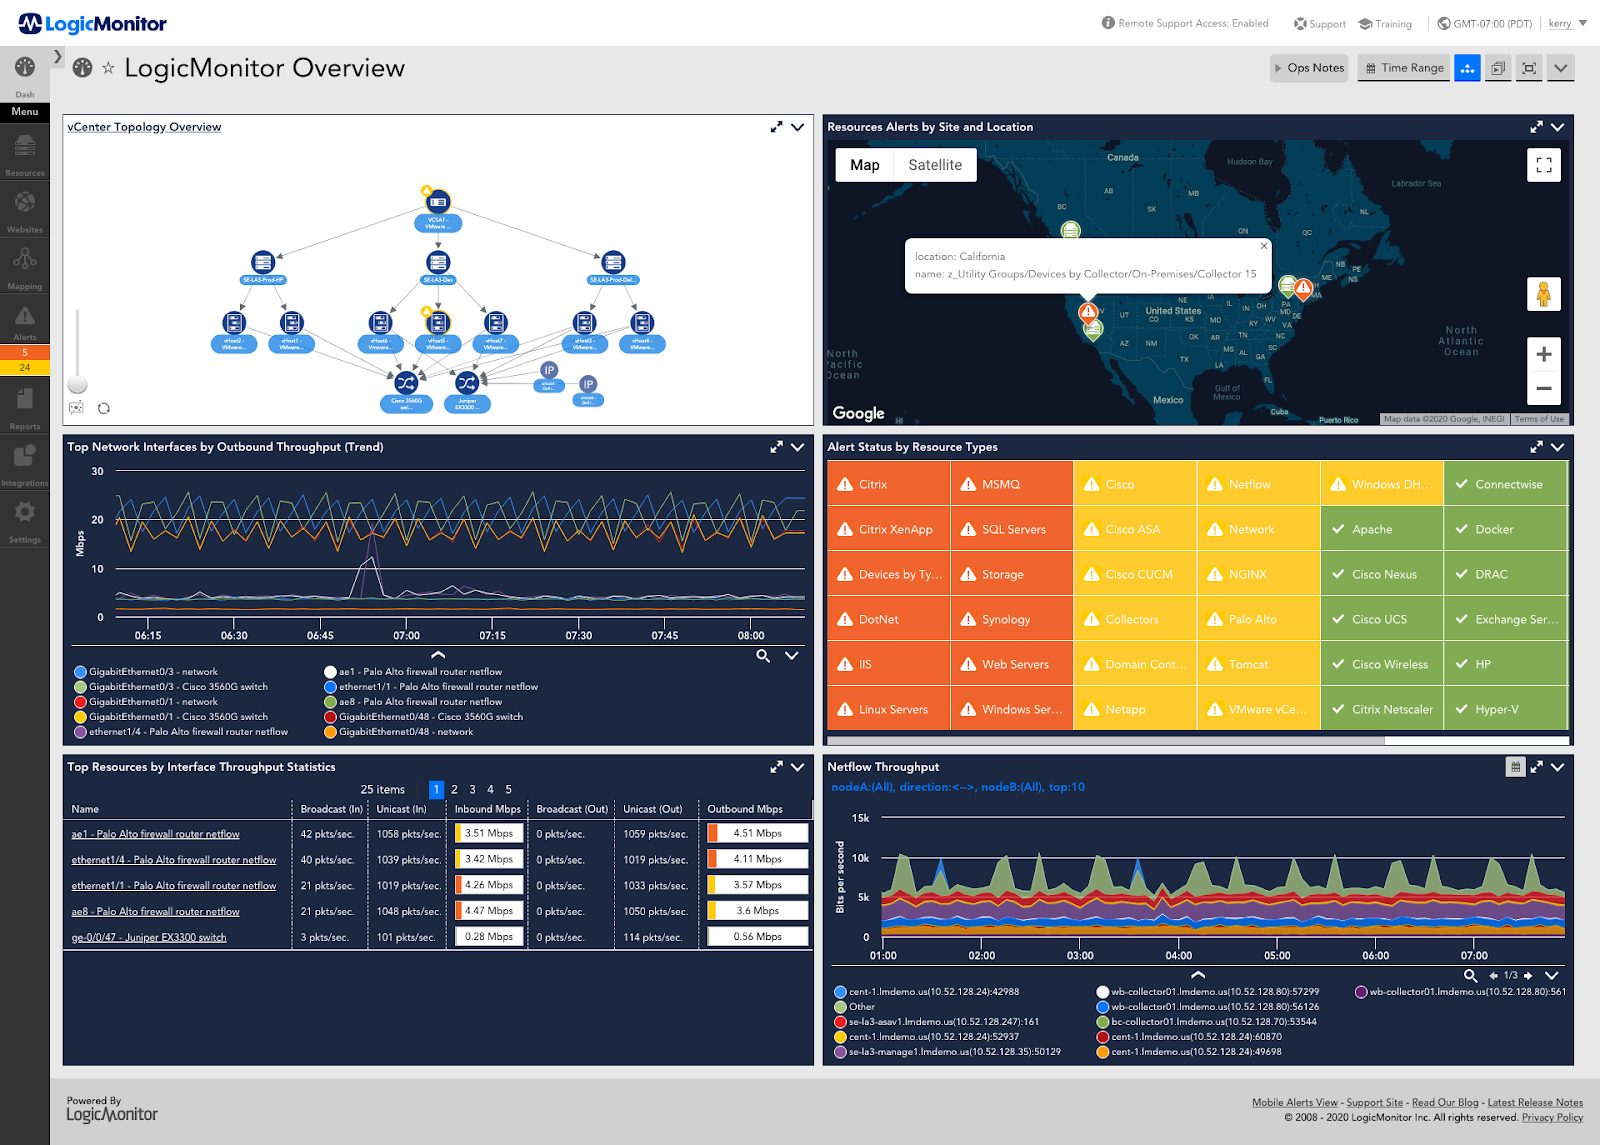
It provides customizable and automated alert thresholds, workflows, and integrations, reducing alert noise and improving business efficiency.
Relevant Features
-
API: Allows users to integrate and connect with other applications and systems, enabling seamless data exchange and automation.
-
Access Controls/Permissions: Allows administrators to set role-based access controls and permissions, ensuring that only authorized individuals can access specific data and perform certain actions within the software.
-
Activity Dashboard: Provides an overview of key metrics, activities, and events within the LogicMonitor software, allowing users to monitor and track real-time performance and status updates.
-
Alerts/Notifications: Sends alerts and notifications to users when predefined thresholds or conditions are met, helping them stay informed about critical issues or changes in their monitored systems or applications.
-
Anomaly Detection: Identify and alert users to abnormal or unexpected behavior in their monitored data, helping them detect potential issues or threats before they escalate.
Pricing
Contact sales for accurate pricing info.
Pros
- Easy setup and monitoring
- Integration with plugins and add-ons
- Full team support
- Infrastructure monitoring capability
Cons
- Weaker mapping functionality
- Improvement needed in AI capabilities
- Lack of workflow automation
- Challenges in pulling data for WAN devices
Rating
4.5 out of 487 reviews
4. Datadog
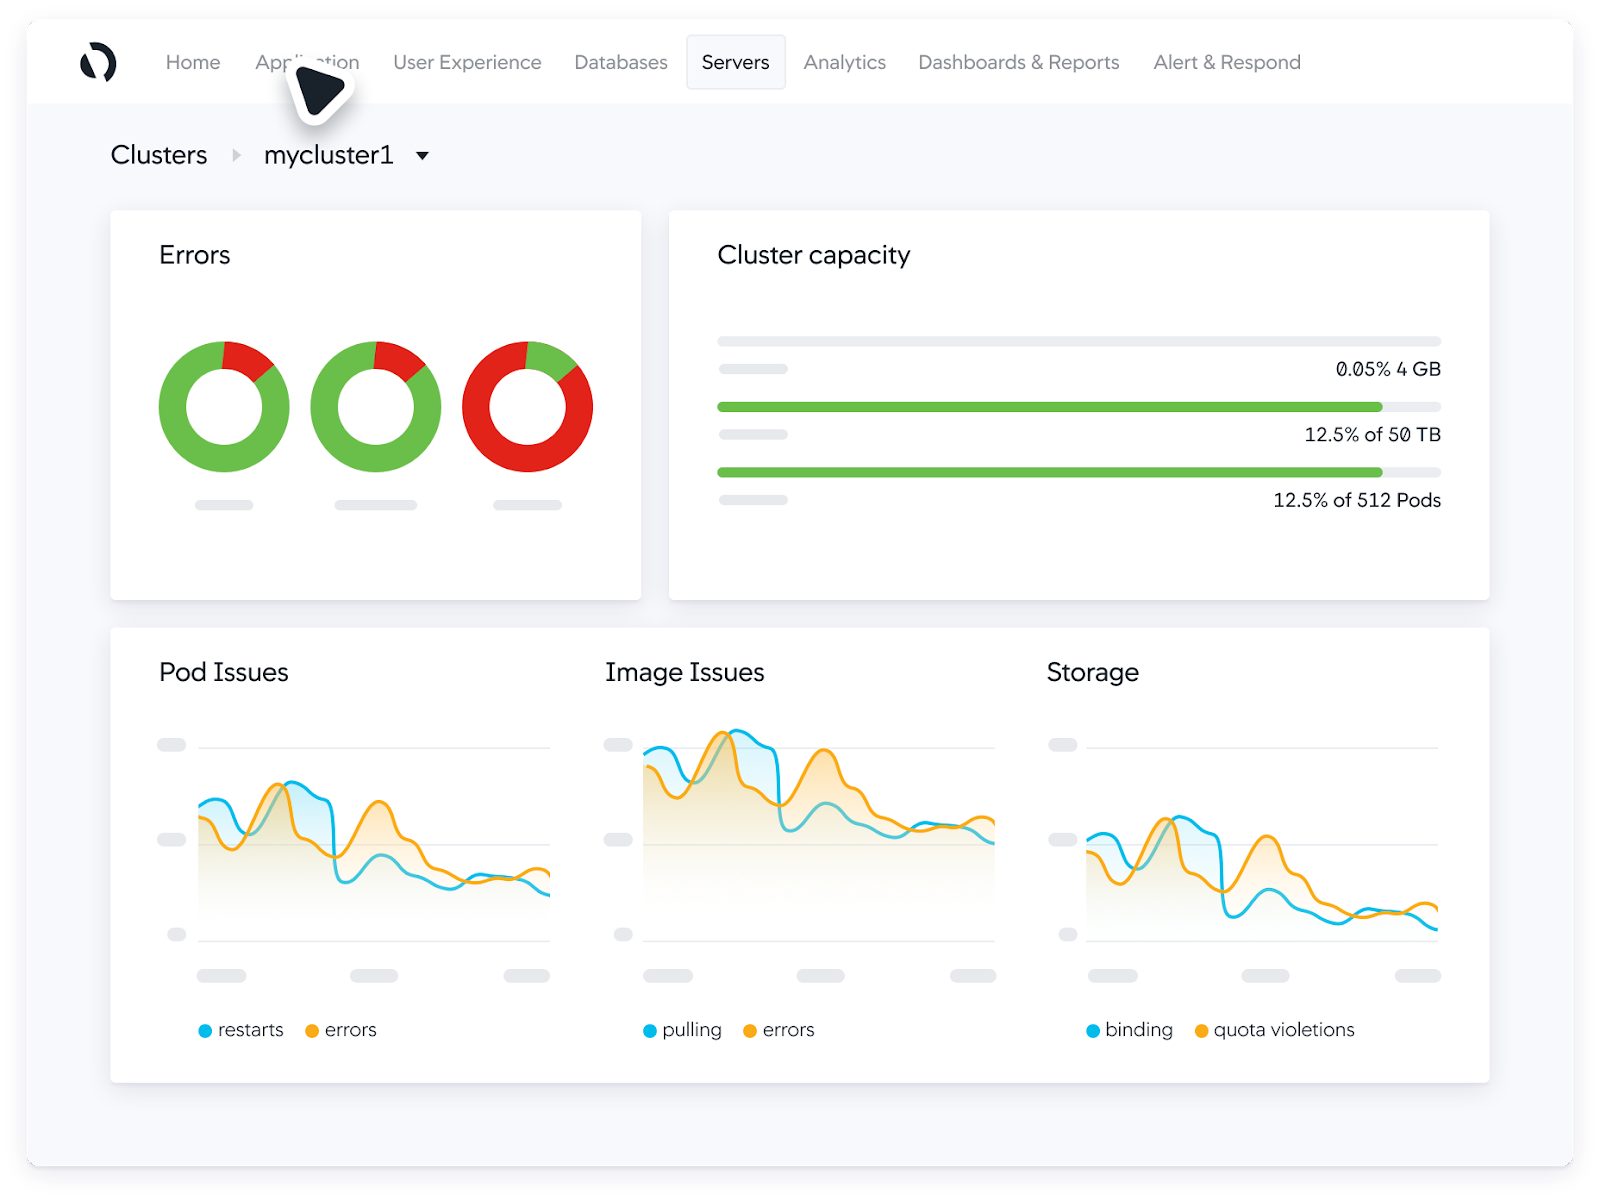
Datadog is a monitoring and analytics platform designed for large-scale applications.
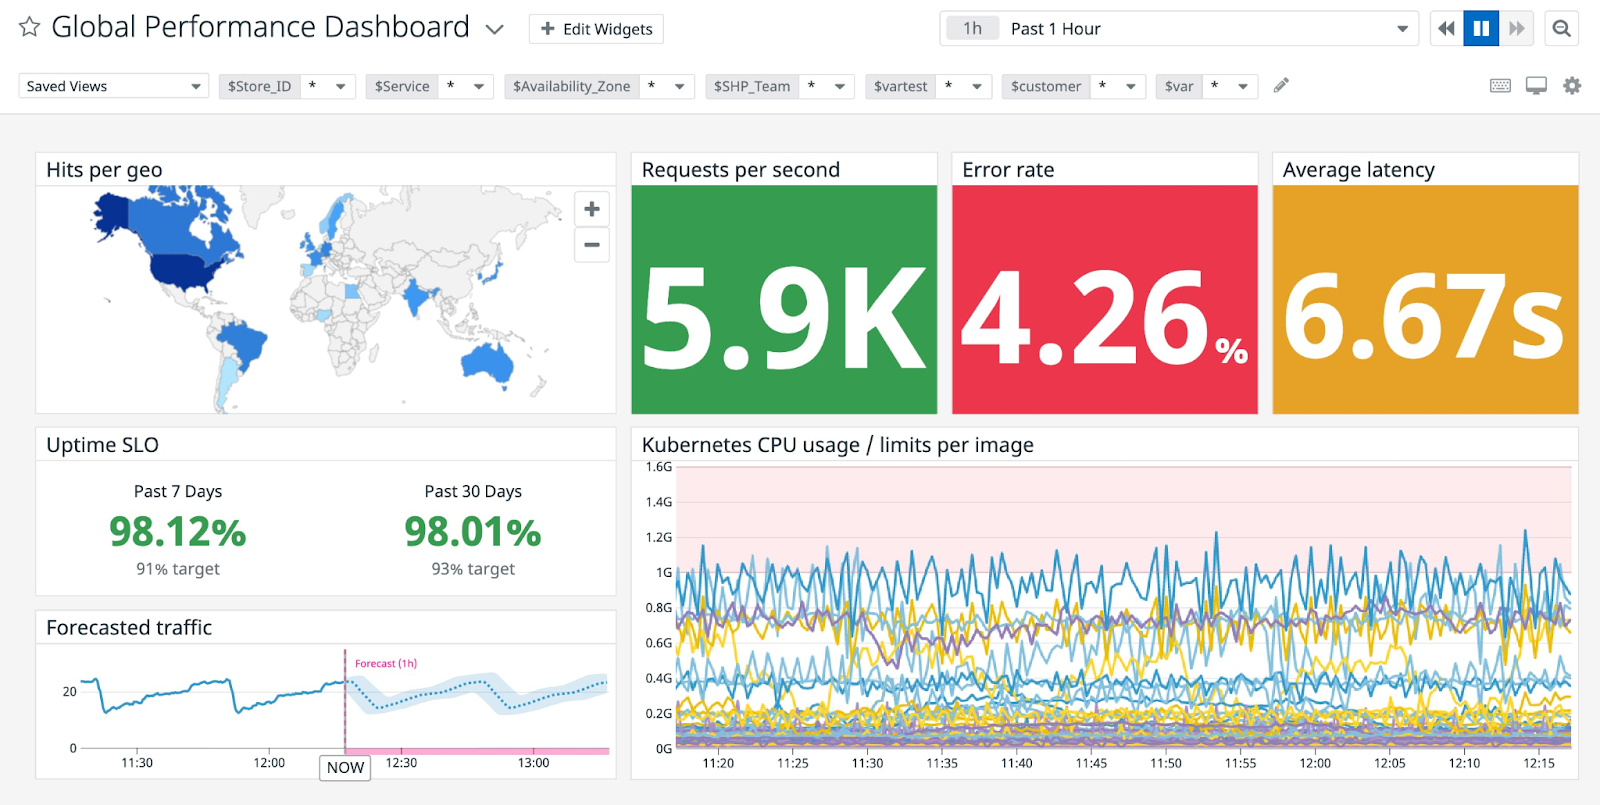
It provides a comprehensive view of an entire stack, allowing teams to troubleshoot, monitor, and optimize their systems. You can also integrate Datadog with Instatus to automate your status page—no more manual updating.
Relevant Features
-
Activity Tracking: Tracks and records user activities and interactions for monitoring and analysis.
-
Ad hoc Reporting: Enables users to create custom reports based on specific criteria and data.
-
Anomaly Detection: Identifies unusual or abnormal patterns or behaviors within the data.
-
Audit Management: Manages the process of tracking, reviewing, and documenting changes or actions within the application for compliance purposes.
-
Feedback Management: Collects, manages, and analyzes user feedback and suggestions.
Pricing
Datadog offers different pricing plans for their serverless monitoring and other services.
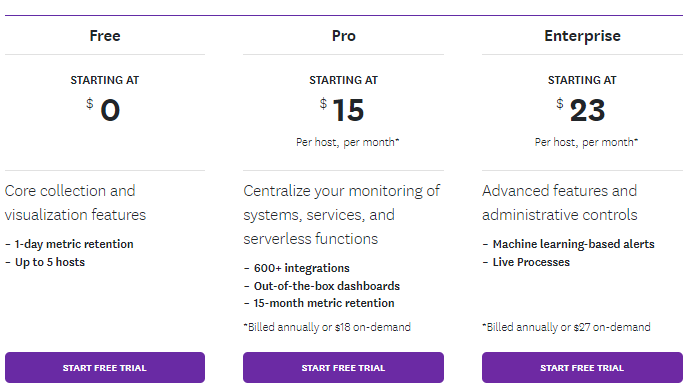
There’s a free plan that offers basic infrastructure monitoring features for up to 5 hosts. Paid plans include Pro ($15+/user/month) and Enterprise ($23+/user/month). Advanced plans feature more integrations, longer data retention, and live processes.
Pros
- Create dashboards as per application, environments, and custom metrics in one panel
- DB monitoring, serverless stack monitoring
- Alerting of production incidents for quick issue resolution
- Handy documentation
Cons
- Navigation can be counterintuitive
- Documentation is lacking in some places
- Initial learning curve
- Configuration of aggregate metrics can be time-consuming
Rating
4.6 out of 224 reviews
5. AppDynamics
AppDynamics offers cloud-native application observability solutions that help businesses deliver great user experiences and drive digital business outcomes.
With a focus on full-stack correlation and the ability to prioritize key business metrics, AppDynamics enables organizations to make informed tech decisions and resolve issues before they impact the bottom line.
Relevant Features
- Behavioral Analysis: Offers insights into end-user behavior using analytics and AI.
- Performance Monitoring: Tracks and measures application or website performance.
- Real User Monitoring (RUM): Analyzes user transactions in real-time.
- Root Cause Identification: Identifies root causes for IT system issues.
Pricing
AppDynamics offers straightforward, flexible, and scalable pricing packages.
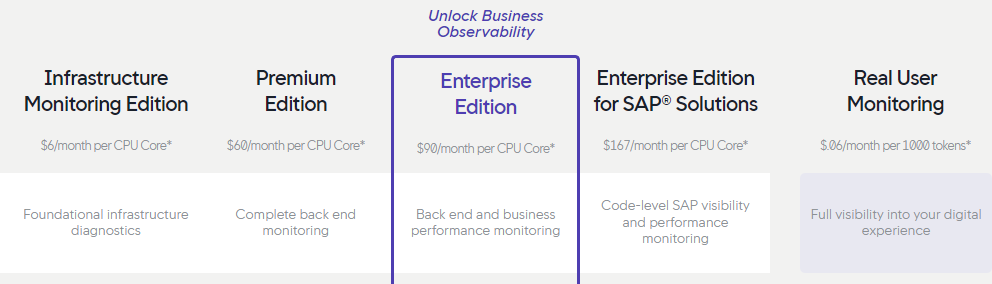
Pricing is based on CPU cores and varies depending on the edition and specific monitoring needs, such as infrastructure monitoring, business performance monitoring, SAP monitoring, and more.
Contact sales for a quote.
Pros
- Error detection in applications and data centers
- Compliance with banking transactions
- Management and correction of errors in the app
- Real-time access to business and operational performance
Cons
- Difficult to use and manage settings
- High learning curve
- Unclear problem identification
- Limited widgets in dashboards
Rating
8.1 out of 10 reviews
6. New Relic
New Relic is an observability platform that offers a wide range of capabilities for monitoring and improving software applications.
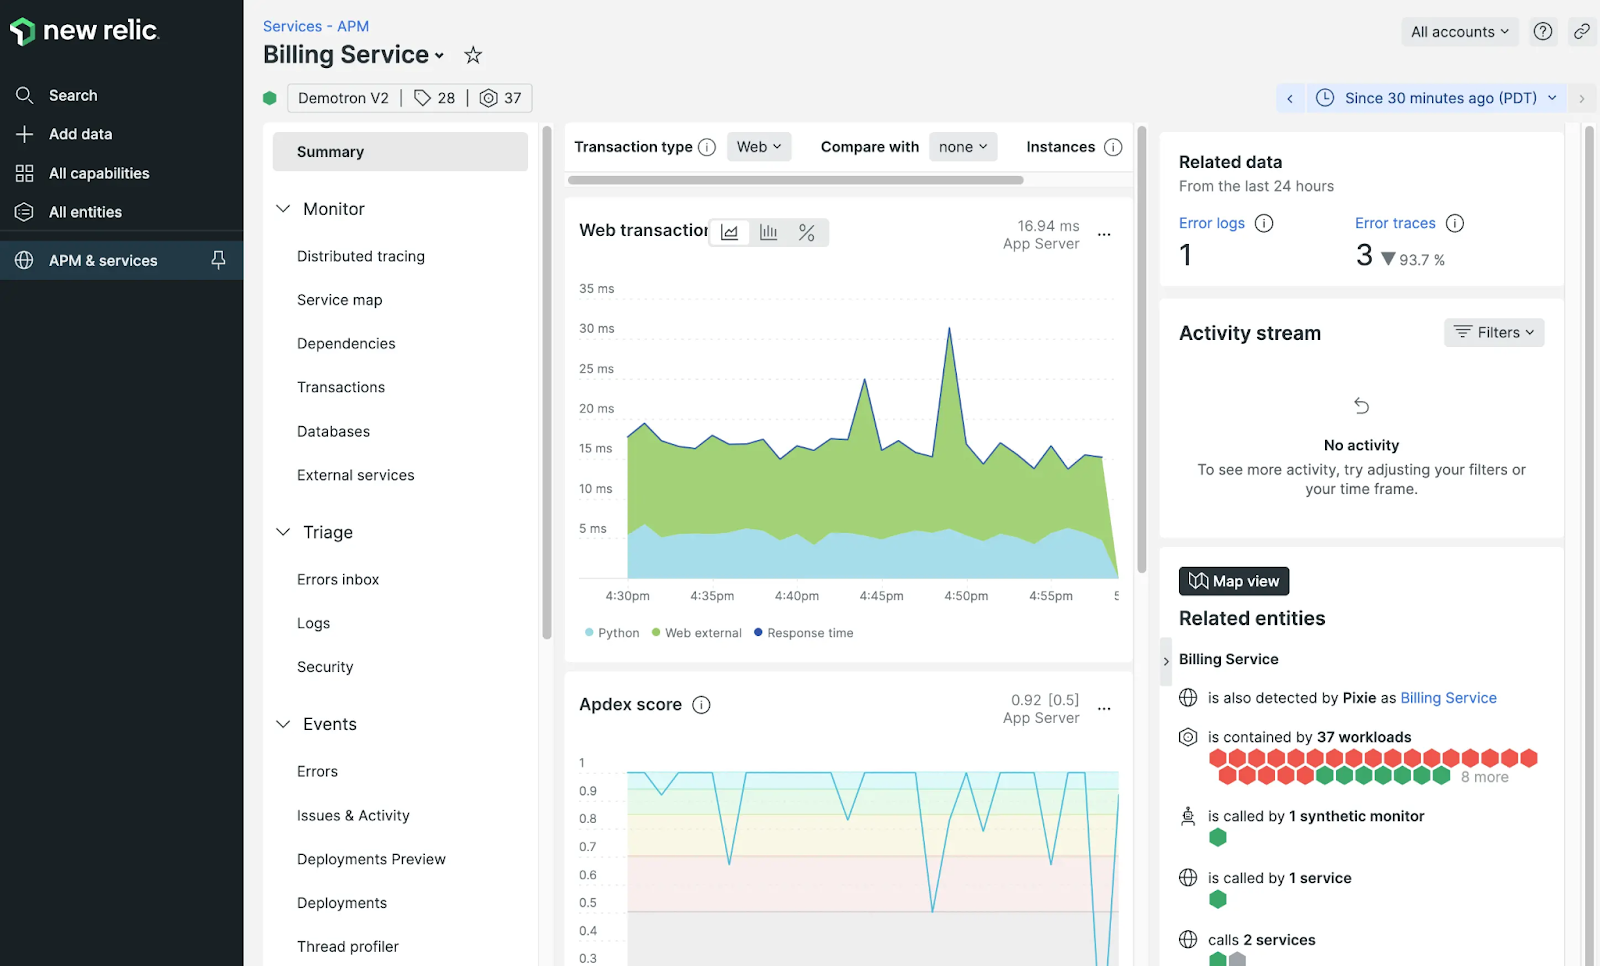
It provides data-driven insights, collaboration tools, and integrated solutions for various aspects of software development, such as security, logs, database monitoring, and more.
Relevant Features
-
Preventative Monitoring: Identify and fix blind spots in your stack for complete visibility and reduced risk.
-
Application Health: Monitor app health at every stage, with insights into user experience and key transactions.
-
Unified, Full-Stack View: Debug faster with a unified view of your stack, including infrastructure metrics and error user impact.
-
Share Context Across Teams: Share insights across the application lifecycle and improve team efficiency with telemetry in IDE.
-
Integrations: Integrates with hundreds of popular services and tools—including Instatus.
Pricing
New Relic offers a free plan with limited access to platform features.
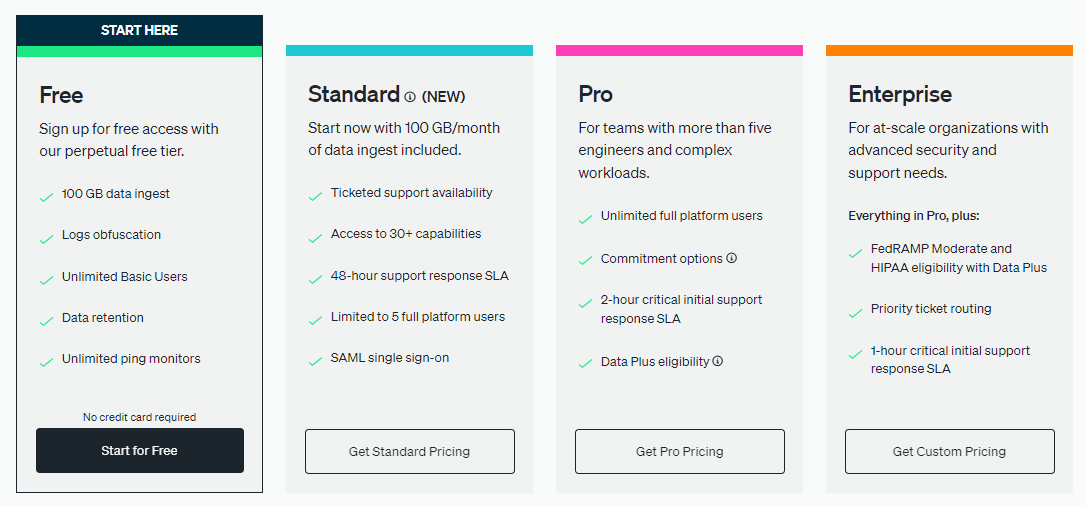
You’ll need to contact sales for a quote for Standard, Pro, and Enterprise plans.
Pros
- Real-time monitoring and visibility of application performance
- Helps identify issues and bottlenecks in web applications
- Synthetic monitoring and alerting capabilities
- Easy implementation and unified experience
Cons
- Issues with interface and data visualization
- Usability and feature overload can be overwhelming
- Higher storage costs
Rating
4.5 out of 1345 reviews
7. Zabbix
Zabbix is an enterprise-ready monitoring solution that offers unlimited scalability, distributed monitoring, and high availability.
It integrates with various systems and has strong community support.
Relevant Features
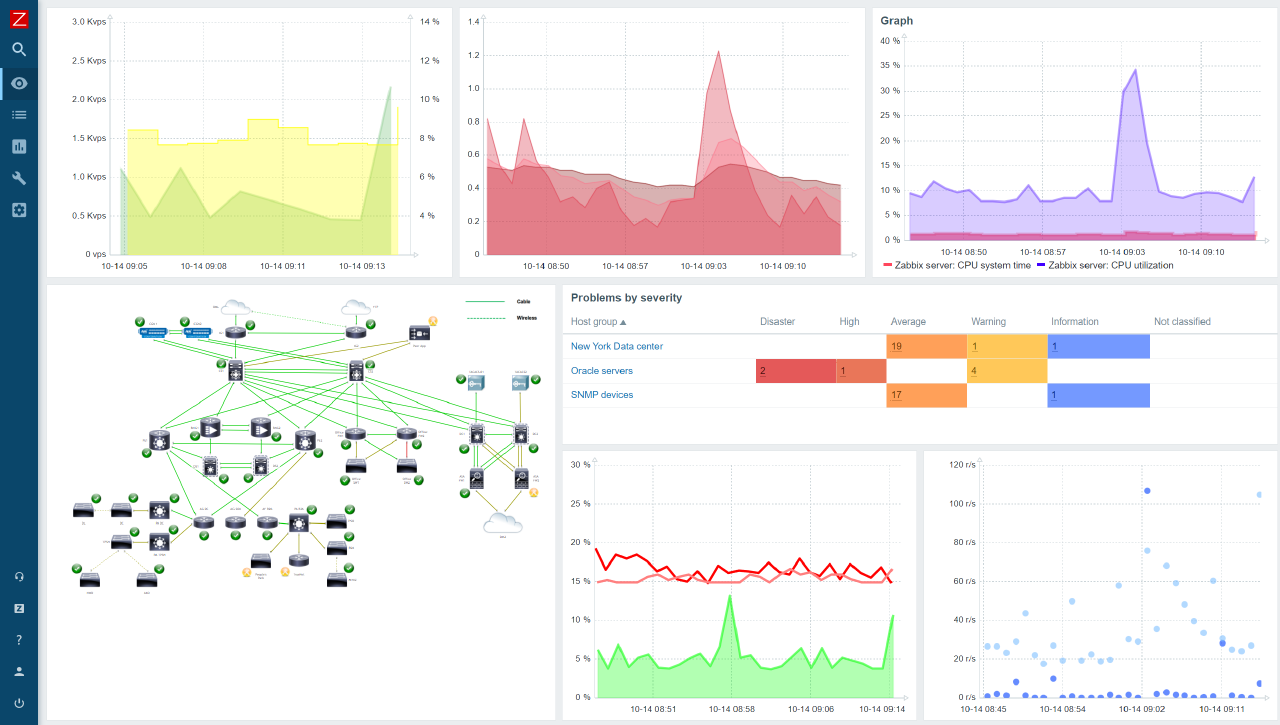
- Single Pane of Glass: Offers widget-based dashboards for a visual overview of your IT environment. Customize widgets based on user permissions.
- Business Monitoring: Track KPIs with root cause analysis, impact assessment, and SLA monitoring. Define service elements with hierarchical service trees.
- Deployment: Easy on-premise or cloud deployment within minutes. Templates for network and resource discovery.
- Open Source: Extend or modify Zabbix freely. Avoid vendor lock-in and zero up-front costs.
- Localization: Contribute and translate Zabbix into preferred languages.
Pricing
Zabbix offers upgrade services to help users benefit from the latest features and minimize downtime. The pricing for these services varies based on the size of the environment, the complexity of monitored devices, and requirements for downtime.
Contact sales for a quote.
Pros
- Easy to configure and use
- Centralized monitoring
- Flexible and customizable
- Distributed control system
Cons
- Extensive documentation lacks examples
- Steep learning curve for new users
- UI/UX could be improved for a better experience
Rating
4.4 out of 298 reviews
8. Pingdom
Pingdom provides comprehensive website monitoring with synthetic and real user monitoring.
It helps businesses optimize site performance, ensure exceptional customer experience, and integrates with tools like Instatus for automated incident management.
Relevant Features
- Real User Monitoring (RUM): Monitor the experience of real users visiting your website, including page load time, interactions, and other performance metrics.
- Transaction Monitoring: Track and analyze the performance of specific transactions on your website, such as form submissions or checkout processes.
- Page Speed Monitoring: Measure and optimize the speed of your web pages to ensure a fast and smooth user experience.
- Outside-In Client-Side Monitoring: Monitor your website’s performance from the perspective of real users accessing it from different locations and devices.
Pricing
Pingdom offers separate plans for Synthetic Monitoring ($10+/month) and Real User Monitoring ($10+/month).
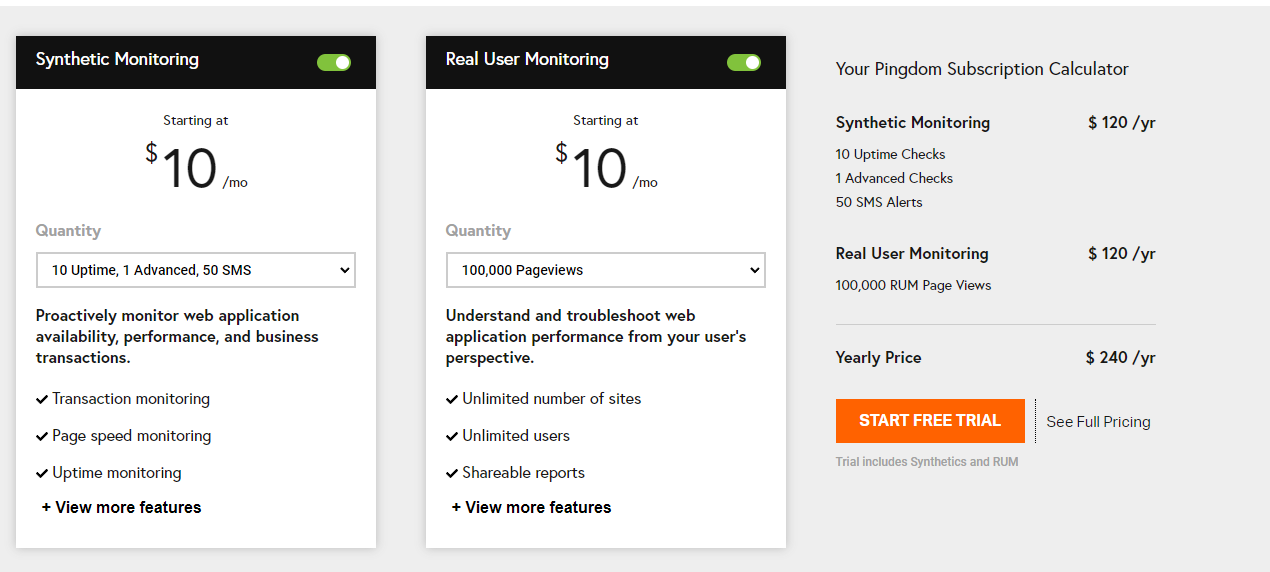
Prices increase based on pageviews for RUM and the number of checks for synthetic monitoring.
Pros
- Helps you stay on top of network outages
- Allows timely assessment of network issues
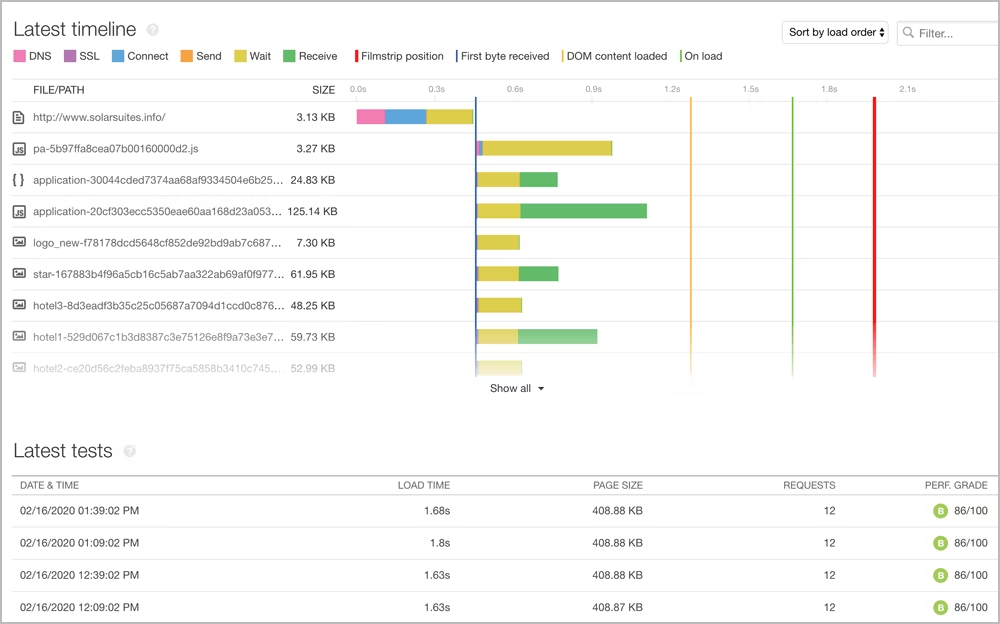
- Provides a “waterfall” view of site performance
Cons
- Slow response and inadequate solutions from tech support
- Complex reports to study
- Error presentation could be improved
Rating
4.5 out of 73 reviews
Conclusion
Exploring alternatives to Site24x7 opens up a world of possibilities for SaaS, DevOps, and developers. These alternatives offer diverse features and capabilities that significantly enhance operational efficiency and customer satisfaction.
Instatus offers DevOps and incident teams a simple, beautiful way to keep users and teammates in the loop regarding service outages and performance issues. Our fast, responsive status pages and integrated monitoring capabilities are designed to make it easy to provide custom notifications and alerts that help customers stay informed.
So why wait? Get started with Instatus today for free and keep your users happy.

Get ready for downtime
Monitor your services
Fix incidents with your team
Share your status with customers