
Optimizing Node.js Performance: Key Metrics to Monitor and Analyze


Every second of delay in a Node.js application can cost businesses dearly in terms of lost users and revenue. In the competitive digital landscape, speed is currency. Users abandon sites that take over 3 seconds to load, as revealed by Google's recent findings.
Node.js, while lauded for its efficiency, is only as robust as the optimization and monitoring strategies developers employ. Each component complements the other; without monitoring, optimization becomes mere guesswork.
Just think, can your business really afford to play out of tune?
-
If you're not monitoring the right metrics, you're flying blind, risking both user satisfaction and profits.
-
Without active optimization, even the most robust Node.js applications can falter under the weight of growing user demands.
-
Neglecting performance is a silent business killer, pushing away potential customers without any overt warning signs.
Hence, Node.js performance is not merely advantageous but indispensable. This article unravels the essential metrics for achieving this optimization. Dive in to find out how to keep your application hitting all the right notes.
Understanding Node.js Performance Metrics
With its non-blocking, event-driven architecture, Node.js is renowned for delivering high-speed applications. Yet, this prowess isn't automatic; it's hinged on diligent monitoring and optimization. By regularly assessing vital metrics, developers can pinpoint inefficiencies, eliminate bottlenecks, and ensure seamless user experiences.
It's about fostering a comprehensive, intelligence-driven understanding of each segment within the Node.js architecture. Whether it's event loop latency, memory usage, or CPU profiling, each metric offers a unique lens into the application's health.
It's not just about collecting data but also figuring out what that data translates to. Monitoring grants developers a clear window into the intricacies of their Node.js setup, be it
- Tracking application availability
- Sifting through logs
- Or preemptively identifying potential dysfunctions
So, Which Metrics Should You Keep an Eye On?
It’s more than clear that understanding Key Performance Metrics is pivotal for optimal Node.js application health. A startling statistic reveals that 80% of performance issues can be traced back to just 20% of overlooked metrics.
Here are some of the most crucial metrics while optimizing Node.js that demand your attention.
-
Event Loop Latency
One of the foundational aspects of Node.js is its non-blocking, event-driven architecture. The event loop is crucial in handling asynchronous operations. If the event loop starts getting delayed, it signifies a bottleneck which can lead to reduced application performance.
For example, if a user submits a form on your application and there's significant event loop latency, the server might delay processing the form data, leading to slower feedback or response times to the user.
Companies like Netflix, which rely heavily on Node.js, emphasize the importance of monitoring event loops to ensure smooth streaming experiences for millions of their users.
2. Memory Usage
Monitoring memory usage helps in identifying memory leaks which can drastically affect application performance and may eventually lead to application crashes.
For instance, over time, if a particular feature of your app consistently increases memory usage without releasing it, it could signify a memory leak that needs to be addressed.
3. CPU Profiling
CPU profiling allows developers to see the cost of computational tasks. High CPU usage might mean that certain tasks are computationally intensive or not optimized.
For example, if a specific API endpoint, say for image processing, consistently uses a high percentage of CPU, it might need optimization or offloading to a dedicated service.
4. Request Rate
This metric monitors the number of requests your application receives over time. A sudden spike or drop can indicate various issues or a need for scalability.
For instance, if your application receives a surge in traffic during a sale and the request rate skyrockets, your servers need to be prepared to handle that load without degrading the user experience.
5. Error Rate
It reflects the number of requests resulting in an error. A high error rate might indicate a problem with the application code, infrastructure, or external services.
For example, after deploying a new version of your app, if there's a noticeable uptick in the error rate, it could indicate a bug or an unforeseen issue with the recent changes.
Dive into Node.js Profiling & Monitoring with the Right Tools
With the right tools, developers can seamlessly track, analyze, and optimize their application's behavior. Whether you aim to uncover bottlenecks, diagnose memory leaks, or simply keep an eye on real-time performance metrics, there's a tool designed to assist you.
Let’s delve into some of the most prominent profiling and monitoring tools available for Node.js.
-
Middleware
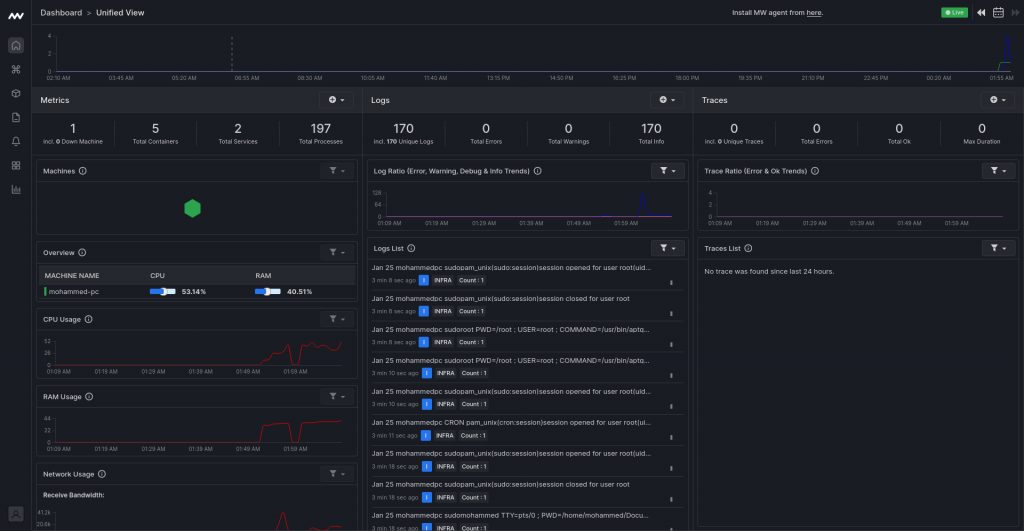
A paragon of eBPF-based observability, Middleware offers unparalleled insights into your application’s performance. From its intuitive dashboard, developers can glimpse the entirety of their application landscape.
Beyond merely flagging issues, Middleware ensures you're equipped with the knowledge to troubleshoot, presenting correlated metrics, logs, KPIs, traces, and real-time data in a unified view.
-
PM2
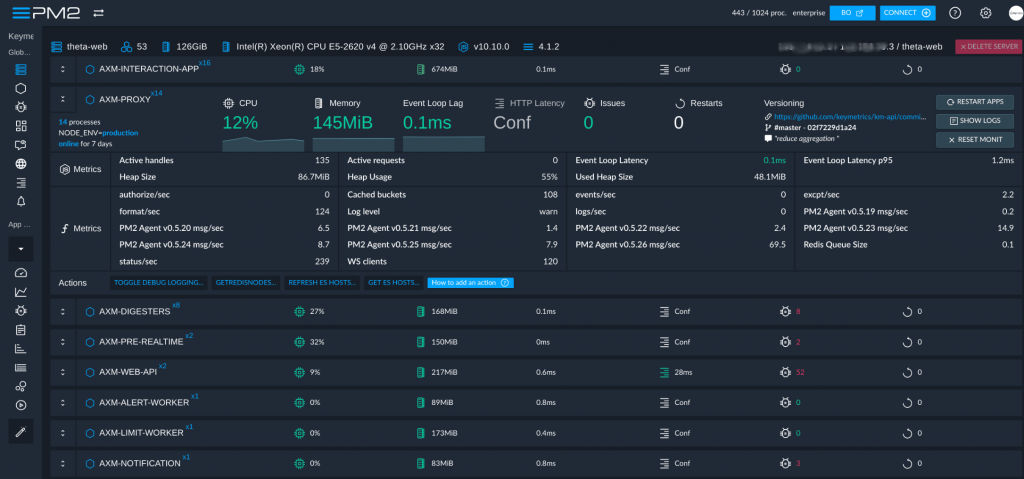
PM2 is a standout tool in the Node.js ecosystem, designed primarily for its functionality in log monitoring and auto-clustering. This daemon-process manager is a guardian for applications, offering a robust shield against potential failures, including the dreaded event loop lag.
Its intuitive dashboard provides developers with real-time insights into crucial performance metrics. Its ability to give a rapid overview of application health, combined with features that prevent unexpected downtimes, makes PM2 an indispensable tool for those keen on ensuring consistent and reliable Node.js application performance.
-
Prometheus
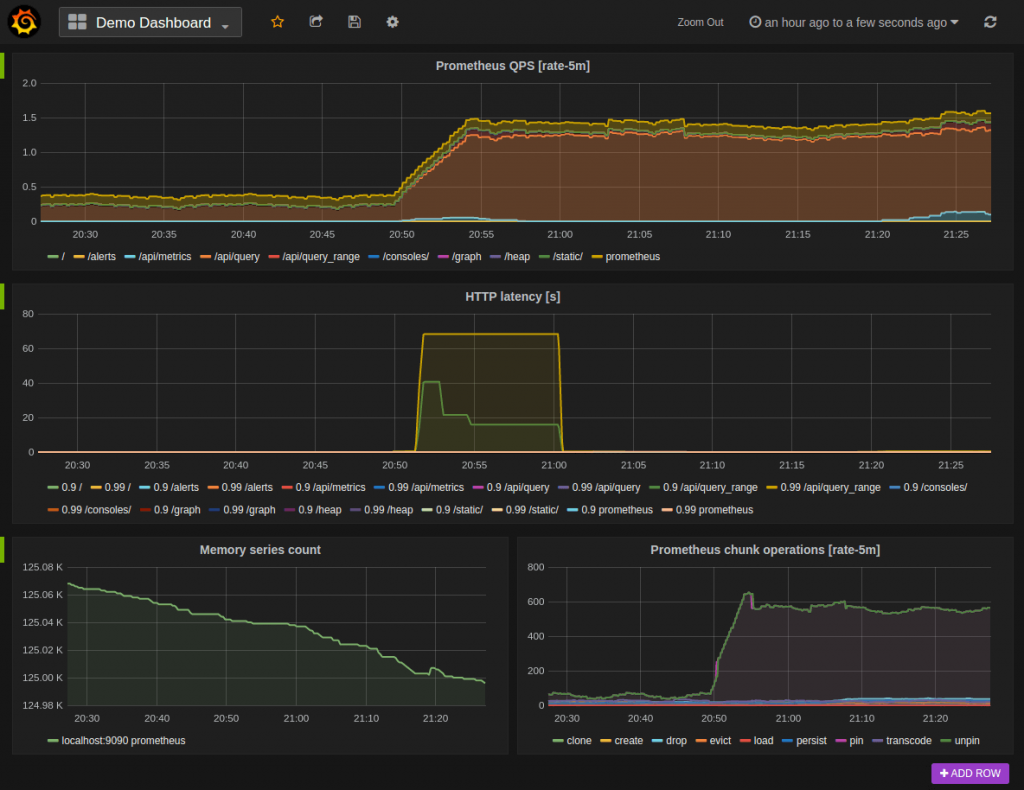
Prometheus distinguishes itself with its ability to juxtapose historical data against current system metrics. As an open-source monitoring tool, it's particularly adept at chronicling the journey of your application's performance.
Renowned for its multi-dimensional time-series data model, Prometheus also boasts a notification mechanism, alerting developers during crucial events, ensuring proactive rather than reactive solutions.
Winning with Node.js: Top 8 Tips to Stay Ahead
To truly harness the power of Node.js and maintain peak performance, a well-structured monitoring strategy is indispensable. By adopting the following best practices, developers can ensure they're not only tracking the right metrics but also acting on them effectively.
Here are some pivotal tips to supercharge your Node.js performance:
-
Determine What to Monitor
Understanding exactly what elements of your Node.js application require monitoring is foundational. While metrics like latency, error rates, and throughput are fundamental, identifying the crucial logs and events is equally vital. By pinpointing these critical components, you can focus your monitoring efforts where they matter the most.
-
Prioritize and Configure Alerts
Alerts are more than just notifications; they're your first line of defense against potential performance issues. Categorize your alerts into two main types: high-priority and low-priority.
While low-priority alerts can be earmarked for later review, high-priority ones demand immediate attention. Adjust your settings to swiftly identify and address urgent metrics, ensuring that emerging issues are nipped in the bud.
-
Direct Alerts to the Right Team Members
An alert's efficacy is determined not just by its timeliness but also by who receives it. When setting up notifications, especially for critical events, ensure they are channeled to the team members best equipped to handle the issue. This ensures that any raised concerns are addressed promptly and by the right expertise.
-
Optimize Code and Avoid Synchronous Operations
Node.js shines with its asynchronous capabilities. To harness its full potential, developers should focus on refining their code and steering clear of synchronous tasks. By keeping operations non-blocking, applications remain responsive, ensuring efficient performance and improved user experiences.
-
Harness Caching
Caching is a cornerstone of swift data retrieval in Node.js applications. By storing frequently accessed data in a cache, developers can drastically reduce database loads and expedite response times. Implementing effective caching strategies ensures a seamless user experience, marked by reduced latency and consistently fast access to data.
-
Stay Vigilant for Memory Leaks
Memory leaks are the silent performance killers in Node.js applications. They can gradually degrade system efficiency. Continuous monitoring and employing dedicated tools are essential for identifying and rectifying these sneaky issues. Addressing them promptly ensures sustained application performance and a consistent user experience.
-
Balance the Load
Utilizing tools like NGINX or HAProxy, load balancing efficiently disperses incoming traffic across multiple servers. This prevents any single server from being overwhelmed, ensuring optimal performance.
By effectively distributing the workload, load balancing not only boosts application responsiveness but also enhances overall system resilience and uptime.
-
Use the Latest LTS Version
Staying updated with the latest Long Term Support (LTS) version of Node.js ensures stability, security, and access to optimized features. Regularly updating to the LTS version provides developers with crucial performance enhancements and bug fixes, facilitating a smoother, more resilient application experience for users.
Wrapping Up: Node.js Performance Optimization
Optimizing Node.js performance isn't just about squeezing out milliseconds from execution times—it's about creating reliable, resilient, and user-friendly applications. From the intricacies of pinpointing the right metrics to monitor to the adoption of sophisticated tools and practices, a proactive approach to optimization ensures your application stands out in a sea of mediocrity.
Regularly updating software versions, implementing caching, and embracing load balancing are more than best practices; they're prerequisites in today's digital landscape. As developers, our mission is clear: craft applications that are not only efficient but also delight users at every interaction.

Get ready for downtime
Monitor your services
Fix incidents with your team
Share your status with customers