Here’s Our In-Depth Guide to Observability in DevOps

Helpful Summary
- Overview: The article explains observability in DevOps, why it matters, and the best practices to implement.
- Why you can trust us: At Instatus, we've helped leading brands like Deno, Graphite, Restream, and many others achieve widespread success. These companies have benefited from our real-time, transparent status updates and seamless incident management, which helps maintain smooth operations and ensures swift issue resolution.
- Why it matters: Observability in DevOps enables teams to proactively monitor, detect, and resolve issues in real-time, ensuring that systems run smoothly and deliver top-notch performance.
- Action points: Learn the fundamentals of observability, including the roles of logs, metrics, and traces in monitoring system performance.
- Further research: Check out our blogs for more insights into incident management and DevOps implementation, as well as best practices, trends, and strategies. :
Why Do You Need Observability for Your Business?
Have you ever worked on a team but felt more like you were on your own?
Silos are an unfortunate byproduct of online workplaces, where there’s not enough communication and collaboration between teams and departments. This has led to a lack of control over quality checks and monitoring.
Whether it’s on-premise or cloud environments, development teams shouldn’t be siloed when monitoring numerous technologies and software. They need to be available at all times to keep a shrewd eye on critical apps. If not, their slow response could cause system-wide issues and fail to pinpoint the cause of system lag or failure.
Wouldn’t it be great if you could gain real-time insights into system performance, detect and diagnose issues faster, and improve reliability and availability?
Silo-ing and poor oversight become a thing of the past with observability! You will gain deeper insights into your systems by analyzing your constantly evolving environments in real-time, empowering you to make swift and assured decisions with confidence.
What exactly is data observability, and how can your DevOps benefit? What are the challenges to implementing it? This Instatus article will delve into the nitty-gritty of all this and more. Let's get started!
Why Listen to Us?
Instatus directly enhances observability for organizations like Deno, Restream, and Graphite by offering a real-time, attractive status page that monitors system performance, uptime, and incidents. This makes it easy for teams and users to stay informed about the health of services.
It provides a clear and accessible overview of ongoing issues and past incidents, enabling quick communication during outages or downtimes. This transparency keeps stakeholders updated while teams focus on resolving issues.
Integrating monitoring tools and alerting capabilities means we help streamline incident management, improve response times, and boost overall system reliability.
What is Observability in DevOps?
Observability in DevOps refers to the software tools and methodologies that help Dev and Ops teams gain real-time insights from a large amount of performance data. Collecting and analyzing this data allows DevOps teams to monitor, improve, and enhance the application for a better customer experience.
Organizations today rely on DevOps teams, continuous delivery, and agile development to make the software delivery process faster and more seamless than ever before. A drawback of this increased speed is that it can be challenging to promptly detect and address issues.
So, you need modern observability techniques like distributed tracing, which enables you to track requests and identify performance bottlenecks across all components of a distributed system.
Observability helps teams monitor system performance, detect and diagnose issues in real time, and understand the root cause of failures. It goes beyond traditional monitoring by allowing proactive detection of anomalies and bottlenecks, facilitating faster troubleshooting and more informed decision-making.
Benefits of Observability
Do you want to gain deep insights into the internal state of systems through the continuous collection and analysis of data such as metrics, logs, and traces?
According to a 2024 Observability Survey report, an impressive 79% of organizations that adopted centralized observability reported saving time and money. Let’s discuss its myriad benefits.
1. Faster Issue Detection and Resolution
Observability enables teams to identify performance bottlenecks, errors, and failures promptly. This, in turn, helps minimize downtime by facilitating faster troubleshooting.
For instance, Instatus integrates with monitoring tools to automatically update status pages when issues arise, enabling faster response times. It centralizes incident tracking to help teams document and resolve issues more efficiently. Stakeholders are quickly alerted to any problems thanks to its multi-channel notification feature.
2. Proactive Monitoring
By gaining a thorough understanding of how the system behaves, teams can proactively detect and resolve any potential issues before they affect end users, ultimately enhancing the system's overall reliability.
3. Improved Performance Optimization
By continuously monitoring and analyzing the performance of various services in real-time, teams gain insights into the inner workings of their systems.
This in-depth understanding lets them make targeted optimizations, identify and address inefficiencies, and proactively ensure their infrastructure runs smoothly and reliably.
4. Enhanced Collaboration
Observability improves communication and collaboration among development, operations, and other teams by providing a shared understanding of the system's status.
5. Increased Customer Satisfaction
Early detection and resolution of issues reduce interruptions, enhance service dependability, and elevate user satisfaction levels. This can give your customers an experience they’ll enjoy and rave about to others.
6. Improved Decision-making
Harness the power of data-driven insights so teams can make informed decisions about capacity planning, performance enhancements, and infrastructure scaling.
7. Reduced Operational Costs
Observability reduces downtime and enhances operational efficiency by facilitating quick root-cause analysis. This lowers the cost of addressing issues while improving the overall efficiency of operations.
8. Digital Innovation
The most inventive and forward-thinking firms are leveraging observability tools. C-suite executives are steadfastly committed to achieving digital transformation.
However, persistent outages, downtimes, and service issues can significantly impede the progress of development teams and hamper innovation. Because of this, it’s imperative to streamline tasks and do everything possible to increase productivity and reduce downtime.
Three Main Pillars of Observability
Implementing on-premise or cloud observability doesn't have to be scary or overwhelming, despite its perceived complexities.
By focusing on the three pillars that contribute to successful observability—metrics, logs, and traces—you can create a robust foundation for gaining in-depth insights into system performance and behavior. This empowers you to monitor, troubleshoot, and optimize your systems proactively.
Metrics
Metrics are quantitative data points that help gauge various facets of system performance, including:
- CPU usage
- Memory consumption
- Request rates
- Error rates
- Response times
These metrics offer a bird's-eye view of the system's overall health and performance. Teams can use this overview to track performance trends over time, establish alerts for specific thresholds, and promptly evaluate whether the system is functioning within expected parameters.
For example, metrics help you monitor if an API's average response time is within acceptable limits.
Logs
Logs are granular, timestamped records of events that occur within a system. They capture the what, when, and why of system events.
Logs are vital for understanding the sequence of events leading up to an issue and play a key role in answering questions about how to prevent the issue from recurring.
For example, you can analyze error logs to determine why a specific service failed during a deployment.
Traces
Traces serve as a detailed record of the path taken by a request or transaction as it travels through different services and components. They document the entire journey, from its inception to its outcome.
Traces offer valuable insights into the performance and behavior of distributed systems by capturing important data. They help teams pinpoint bottlenecks, latency issues, and the specific components involved in processing a request, answering important questions about "where" and "why" during performance analysis.
Tracing is important for identifying the root cause of each issue and quantifying the workload carried out by each component, making it a vital aspect of data observability.
An example of the practical use of tracing is following a user request through a microservices architecture to pinpoint where latency is introduced.
Integration of the Three Pillars
A combination of metrics, logs, and traces allows you to delve into the nitty-gritty of a system's performance and behavior. Metrics give you the big picture, logs offer specific details, and traces unveil the flow of requests and dependencies. Together, these pillars help organizations observe their DevOps and improve the performance of their systems.
Best Practices for Successfully Implementing Observability
Implementing observability in a DevOps environment requires a strategic approach and adherence to best practices. Here are the essential best practices to follow:
- Identify what you need to observe based on your business objectives, such as improving uptime and performance or streamlining troubleshooting.
- Prioritize the key metrics and logs for maximum impact.
- Incorporate all three pillars of observability.
- Ensure observability tools cover all aspects, from infrastructure to applications and services.
- Store logs that solely furnish insights about critical events.
- Promote cross-team collaboration by providing development, operations, and other teams access to observability tools and insights.
- Avoid default graphs. Instead, design a graph that meets the specific requirements of the user.
- Review observability data periodically to spot trends.
- Maintain high-quality data collection to avoid false positives or negatives in your alerts and analysis.
- Ensure that alerts are enabled exclusively for critical events.
- Use unified dashboards, making correlating insights across different components easier.
Enhance Observability with Instatus’ Status Page
Observability enriches you with profound insights into your system's behavior to diagnose issues more accurately.
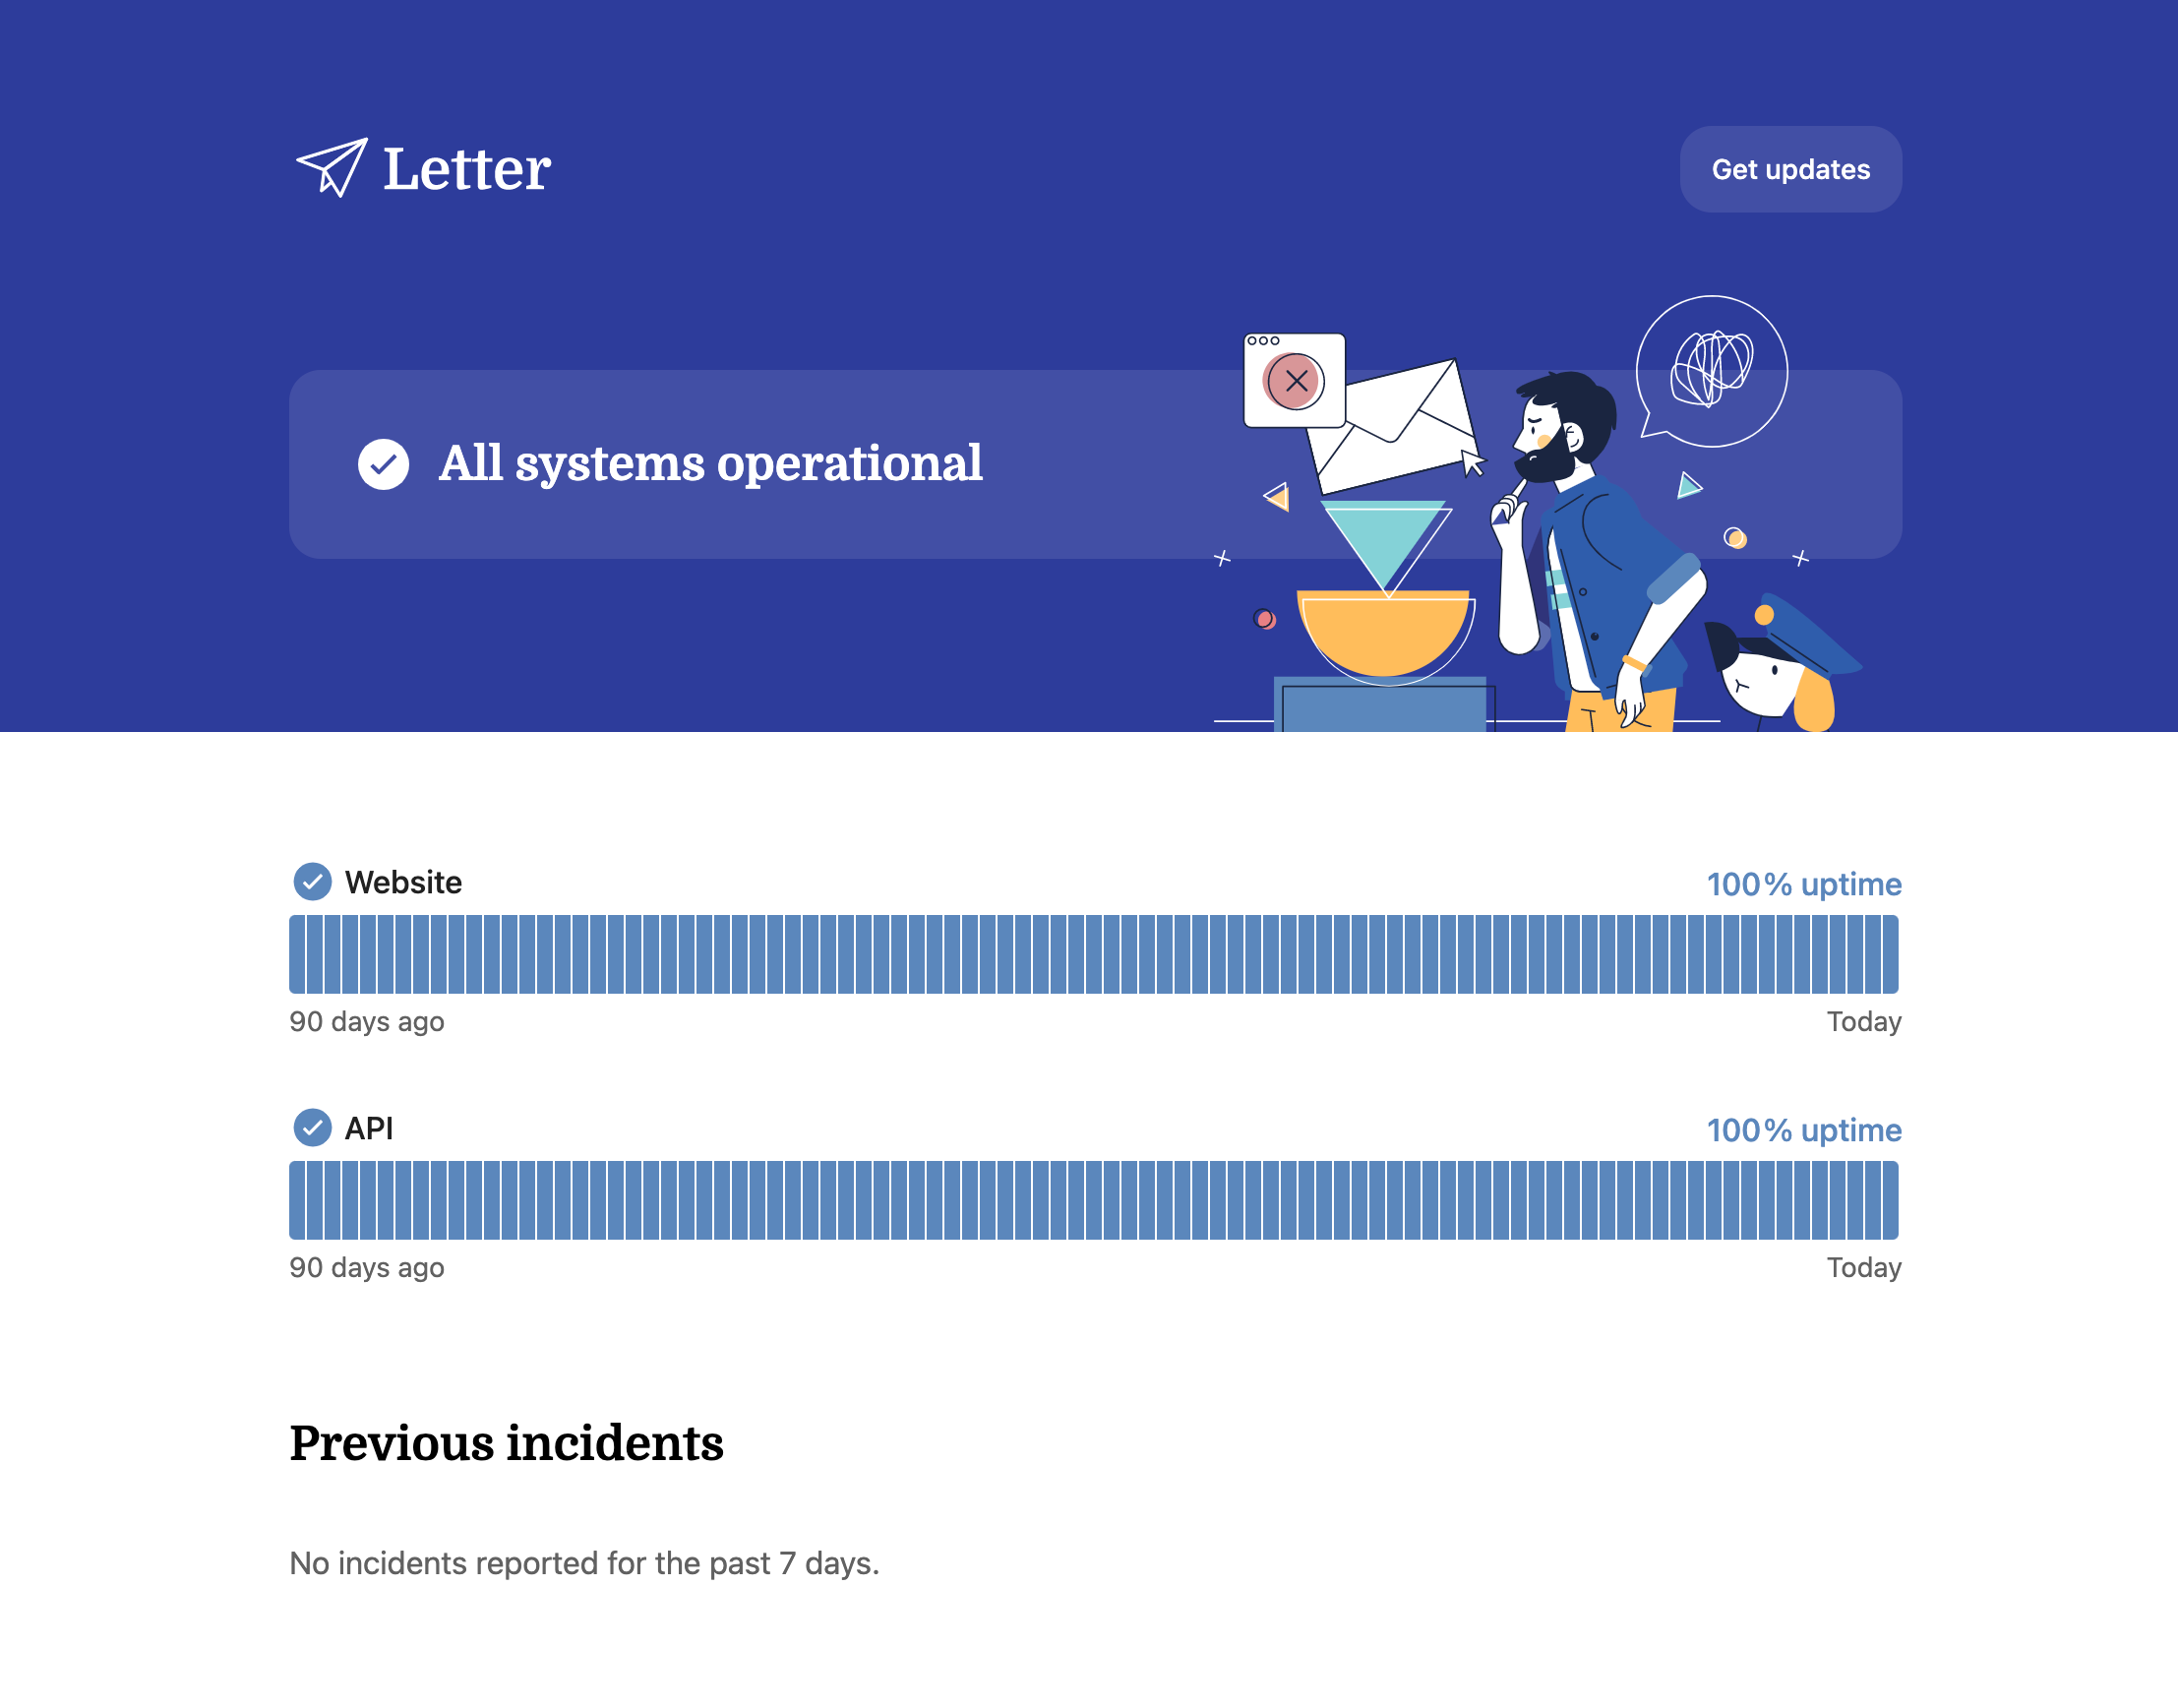
Through customizable status pages and seamless integrations with monitoring tools, we at Instatus ensure that critical information is shared promptly, reducing uncertainty and improving overall system reliability.
Keep your users informed about your current status, new incidents, and upcoming maintenance, enhancing transparency within your organization. By centralizing incident reporting, tracking, and updates, our system complements existing observability practices, helping organizations more quickly manage and resolve issues.
Create your account today to see the Instatus status page in action.
Get ready for downtime
Monitor your services
Fix incidents with your team
Share your status with customers


