
DORA metrics & What They Reveal

How does your development team stack up against others? Is your team high-performing or low-performing? You need DORA metrics, if you don’t know how to measure your team’s performance. Continue reading to learn what DORA metrics are all about and how to track DORA metrics over time.
With DORA metrics, your team will understand how they compare to competitors but, more importantly, will know where changes need to be made to improve team performance. You need excellent monitoring services, to keep track of DORA metrics.
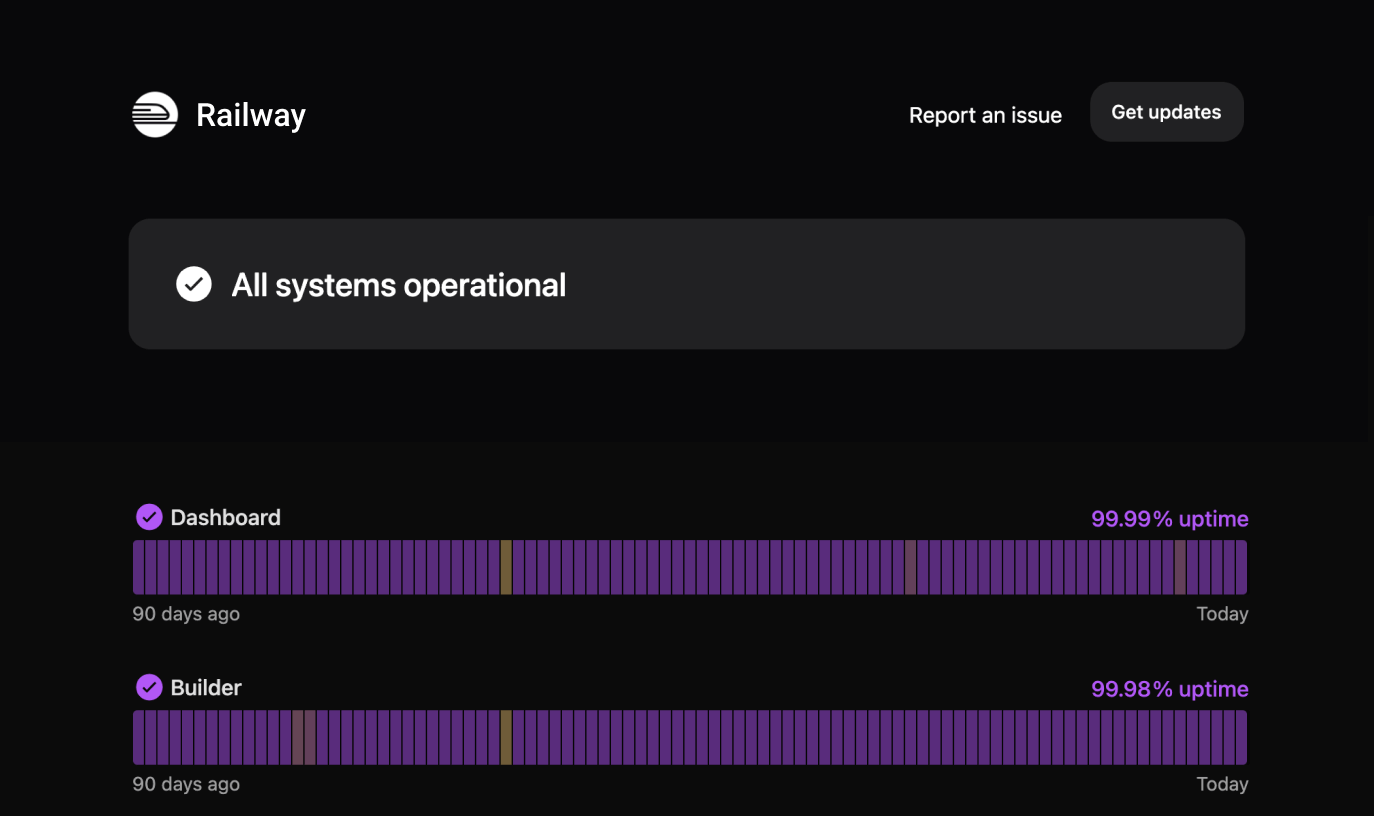
Instatus provides simple and beautiful status pages for all your services. You can use Instatus to monitor your MTTR and even Change Failure Rate.
What are DORA Metrics?
DORA metrics provide a way to quantify the success of DevOps methodologies. The core logos behind DevOps, is the continuous integration and continuous delivery process, or CI/CD, to deliver better and better software products.
Over 6 years of research by the DevOps Research and Assessment (DORA) group culminated in the outlining of 4 key metrics. DORA surveyed development teams worldwide across various industries to better understand the similarities among high-performing development teams. DORA was acquired by Google in 2018 and continues to lead in the DevOps space. DORA is committed to improving DevOps systems and wants to help teams produce high-quality software.
These 4 metrics have proven to be excellent indicators of how a development team performs and delivers software. DORA metrics’ core objective is measuring DevOps teams to understand their performance, whether they are low or elite performers, as far as software development and delivery goes. Many organizations have already adopted these metrics as their primary means of evaluating team success. The 4 DORA metrics are:
- Deployment Frequency
- Lead Time for Changes
- Mean Time to Recovery (MTTR)
- Change Failure Rate
Why are DORA metrics important?
Quantifying DevOps metrics, specifically the 4 DORA metrics, allows development teams to identify ways to be more efficient and successful. Without these metrics, teams would be trying to adapt and grow without knowing their weaknesses.
DORA is an industry leader that can be trusted for its data-driven research findings. DORA metrics outline the four key metrics associated with DevOps success. Take the guesswork out of improving your processes and understanding your team with DORA metrics.
Low-performing teams can only go unaddressed for so long before doing critical damage to your organization. Team-based organizations lead to higher productivity, but new challenges are added to the mix. Team leaders must know how to manage the dynamics of differing personalities, strengths, weaknesses, and skills. The best way to do this is by collecting data and quantifying team success.
A high-performing team has the power to make a brand extremely successful. Organizational performance is driven more by collaborative work than the impact of a single manager or developer. The advantage of a high-performing team is undeniable, with implications on profitability, employee turnover, and employee satisfaction.
Hone in on these 4 DORA metrics, and you’ll see a marked improvement in your team’s performance.
The 4 DORA Metrics
If you want to learn how to improve your team, you should start with a firm understanding of the DORA metrics. The DORA metrics are interconnected, and as you track changes in one metric, you will likely see changes in another. Continue reading to explore the 4 metrics and general expectations for high-performing and lower-performing teams.
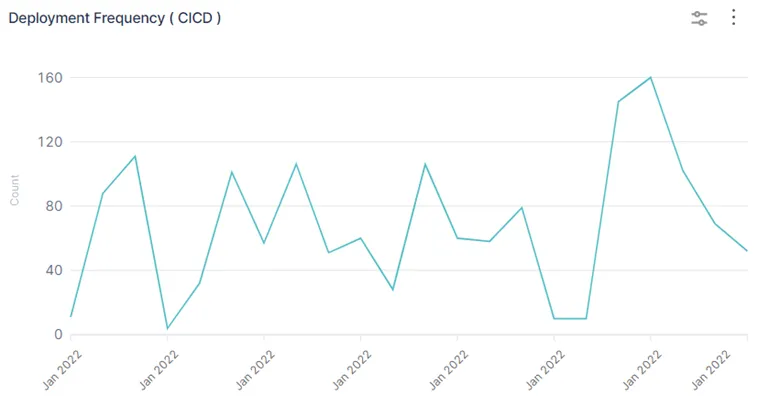
1. Deployment Frequency
Deployment frequency is a metric that tracks how frequently a development team successfully pushes updates into production. The key word in this definition is successful. A software development team that continually delivers broken updates or deployments is not good. That’s the truth, even if it hurts to hear.
This metric is easy to track and very important. Deployment frequency is often the first place a development team may start to make changes. While deployment frequency will vary widely among industries and applications, high-performing teams deliver code for production and launch every day multiple times a week.
Lower performing teams may deploy weekly, monthly, or even bi-yearly. Let’s summarize this for easy visualization:
- Low Performing – One month to six months between deployments
- Medium Performing – One week to one month between deployments
- High Performing – One day to one week between deployments
- Elite Performing – Multiple deployments per day/ less than one day between deployments
2. Lead Time for Changes
The term lead time describes the time between initial code commitment to full deployment to production. When your team decides to implement a UI change, how long does this take to get into production? When your team implements a new security feature, how long does testing take before release?
Lead time is measured from when a team starts working on a code change to the moment it is in the production environment. Lead time can be further broken down by looking at what stage of change development is taking the longest. Is your team spending the most time in development or testing?
Lead time for changes is an important metric because it reflects your team’s flexibility and responsiveness. When a bug arises, how quickly can your team deliver the fix? The most successful development teams have continually improved their development pipeline to reach maximum efficiency. These teams can push changes in hours or days, depending on the magnitude of the change.
Conversely, a low-performing team may need to address an issue from a previous release, but it takes weeks to get to production. This means your customers are left to deal with any bugs or issues with your software. Take a look at the lead times for high and low performing teams:
- Low Performing – One month to six months of lead time
- Medium Performing – One week to one month of lead time
- High Performing – One day to one week of lead time
- Elite Performing – Less than one day of lead time
3. Mean Time to Recovery (MTTR)
Mean Time to Recovery measures the time it takes to recover following an outage, service interruption, or product failure.
This is measured from the initial moment of an outage until the incident team has recovered all services and operations. These events are unavoidable to a certain degree, although good management can significantly reduce the Mean Time Between Failure (MTBF). Because it’s impossible to avoid incidents completely, you need an incident plan that works.
Slow recovery times can impact your organization in more than one way. Your customers will experience a prolonged outage and will view your team negatively for not being able to get the incident resolved. You may lose customers, and the reputation of your brand may be diminished. Additionally, management is less likely to move in an experimental direction if the team cannot keep up with the current, supposedly stable software.
According to Google’s 2019 Accelerate State of DevOps, team performance ranked by MTTR:
- Low Performing – One week to one month of downtime
- Medium & High Performing – Less than 24 hours of downtime
- Elite Performing – Less than an hour of downtime
4. Change Failure Rate
It’s great to have frequent deployments, but what’s the point if your team is constantly rolling back updates. Or even worse, if updates are causing incidents or outages. You should track all deployments that end up as incidents or get rolled back. This is known as the Change Failure Rate (CFR) and is measured as a percentage.
By tracking Change Failure R ate, you learn how often your team is going back to fix earlier deployments. This alerts you to a quality breakdown somewhere in the code development or deployment process itself.
To calculate Change Failure Rate use the following formula:
# of Deployment Failures / Total # of Deployments = % of Change Failure Rate
Of course, the goal is to reduce deployment-associated incidents to almost nothing, but you can use the following baseline to see how your team is performing:
- Low Performing – 45 to 60% CFR
- Medium Performing – 15 to 45% CFR
- High Performing – 0 to 15% CFR
- Elite Performing – 0 to 15% CFR
If your team is performing in the low or medium range, it’s time to examine your processes to make sure code review is thorough and deployment is as automated as possible.
How to use DORA metrics?
You now have a firm understanding of the importance of the DORA metrics and which each metric is measuring, but how do you implement these metrics within your systems?
Improve Deployment Frequency
For years, developers believed that frequent deployments introduced more risk to the stability of the software systems. This couldn’t be further from the truth. Infrequent deployments mean the deployments are much larger, and the team is less familiar with the deployment process.
If you want to improve your deployment frequency, the batch size for updates should be small. Shipping one or two changes at a time, very frequently, will reduce the overall risk associated with deployments. If you want to deploy on-demand, you should develop an automated deployment pipeline. Automating processes reduces the human impact that often causes unexpected deployment issues.
When the goal is to reduce the time between deployments, remember these key points:
- You cannot create shortcuts in the development process to artificially increase deployment frequency. Doing so will result in issues down the line, harming the product and affecting Change Failure Rate.
- Ensure you can effectively monitor and track deployments from start to finish. Once you have data on the current deployment speed, you can make adjustments to reduce batch size.
How to Improve Lead Time for Changes
Improving lead time for changes starts with identifying where your developers spend most of their time. If code creation is slow, revisit your process. Ask the right questions and you will find the answers. Are sprints being used effectively? Are tasks being delegated to the right developers? Is there a knowledge gap on your team? Are there any bottlenecks
For most teams underperforming in the lead time area, testing is the main hurdle. Low-performing teams are more likely to rely on manual testing methods. Manual testing is slow and expensive. High-performing teams implement automated testing methods. Automated testing is extremely valuable because it reduces error and frees up your developers to write more code.
Implement automated testing using tools such as Selenium, Kobiton, testRigor, or Virtuoso. Thoroughly research your options and select the best choice to fit your unique software testing needs.
How to Improve Mean Time to Recovery (MTTR)
Incident management is vital to the security and stability of any software company. You need to be prepared for the worst-case scenario because it will happen someday. If your team's MTTR is lacking, you need to look closely at your incident response plan. Here are the key points to address:
- Preparation
- Perform a risk assessment to determine areas of instability or lacking a backup. What action reduces those risks now, instead of awaiting a failure?
- Test the incident response plan regularly, at least every 6 months. This keeps all team members fresh on how to handle an incident.
- Schedule an on-call schedule and set up proper notification channels so that someone is immediately notified and available in case of an incident.
- Identification
- Ensure there are monitoring processes in place that can identify issues with your software immediately. Any delay in identifying the issue will ripple down to a delay in recovery.
- Containment
- Ensure the problem doesn’t spread to any other unaffected features, areas, or groups of users.
- Use tools like Instatus, to keep your customers informed that a service is down and your team is working on it. This builds customer satisfaction and trust. You can also regularly update customers on expected recovery timetables.
- Recovery
- Use standard operating procedures (SOPs) when possible. These can act as a reference and help your team recover from the incident faster when the step-by-step process for recovery is available.
- Make sure any work or patches needed for recovery are recorded for future knowledge or use.
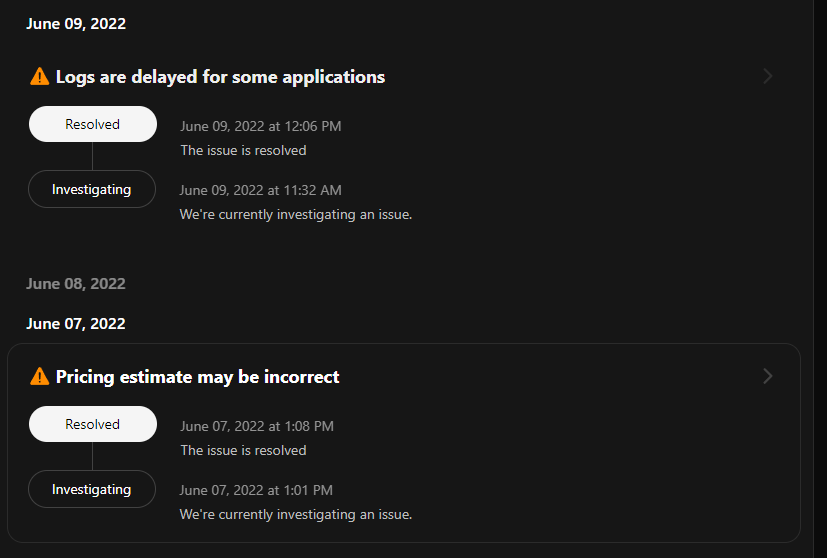
- Notify users as soon as all services have been recovered. Instatus allows you to transition notices to ‘Resolved’. See the example below:
- Post-Incident Review
- Incident response plans don’t end at recovery. To improve in this area continually, you need a post-incident review process. This helps the team identify where the issue originated and if any training or process changes can prevent it in the future.
- Avoid blaming any team member(s), as this will degrade the team culture over time.
How to Improve Change Failure Rate
Here’s the dirty truth about Change Failure Rate: most failed deployments are due to human error during deployment or testing. This means the key to improving CFR is automation, which removes the human element to a large degree. If you can automate your deployment and testing, you are less likely to have post-deployment failures.
Change Failure Rate needs to be combined with the other DORA metrics to see the big picture. CFR may be artificially low because deployments are so infrequent. In this situation, you’d want to slowly increase deployment frequency, while monitoring Change Failure Rate. If CFR begins to creep out of a good range, over 15%, then you should stop and address any issues with deployment or code review.
DORA Metrics Big Picture
Much of the CI/CD development pipeline is about managing speed versus stability. The 4 DORA metrics are more connected than you may think. If you overemphasize speed, to improve deployment frequency and lead time for changes, you may fail to realize the impact on the stability metrics.
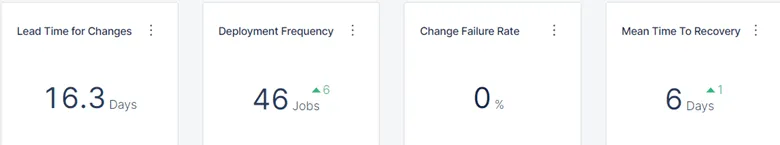
The stability metrics are MTTR and change failure rate. Instead, you want to take a calculated and balanced approach. When tracking these metrics over a period of time, you want to see improvements in all areas at the same time. If you are improving in one area, you may be cutting corners or sacrificing quality in another area. Develop a DORA metrics dashboard for quick and easy access to your team’s trends.
How does your team compare?
Once you have a baseline of DORA metrics for your development team, you can refer to this table to understand how your team measures up:
| Deployment Frequency | Lead Time for Change | MTTR | Change Failure Rate | |
| Low | 1-6 months | 1-6 months | 1 week - 1 month | 45-60% |
| Medium | 1 week - 1 month | 1 week - 1 month | < 24 hour downtime | 15-45% |
| High | 1 day - 1 week | 1 day - 1 week | < 24 hour downtime | 0-15% |
| Elite | Less than 1 day | Less than 1 day | < 1 hour downtime | 0-15% |
Wrapping Up DORA Metrics
You’re a pro on DORA metrics by this point. You can track Deployment Frequency, Lead Time for Changes, Mean Time to Recovery (MTTR), and Change Failure Rate to get a big picture of how well your team is performing. This provides actionable insights on where to focus time and resources, with the goal of a better software product for your customers.
Incorporate Instatus to help track MTTR and CFR, while building brand trust with your customers. Select automation tools like Selenium to automate testing or Jenkins to automate deployment. Your software will be much better for it, and your team can rise to be top performers in the industry. \

Get ready for downtime
Monitor your services
Fix incidents with your team
Share your status with customers